Session 4 - Cartograms & Isochrones
23 Jan 2022Advanced GIS · Sciences Po Urban School
Lecturer: Raphaëlle Roffo
I. Session 4 Overview
Download the slides
- Bivariate choropleths - continued
- Coursework update
- Cartograms: what are they, why use them?
- Isochrones: use cases
II. Tutorial
Goals:
- Building an isochrone map
- Building a cartogram - see slides directly)
Set up the project
Create an Advanced-Session4 folder and add it to your favourites in your QGIS Browser. Set your CRS to EPSG:3857, because we will be using WebMercator projection, and our data will come from OpenStreetMap. Add a basemap of your choice - for instance CartoDB Positron - to your map canvas. If you do not have basemaps under the XYZ Tiles section of your browser, refer to the Intro to GIS Session 3 tutorial to set it up.
Zoom onto the London area, and save your project as Advanced-Session4.qgz.
III. Installing the TravelTime plugin
3.1 Install the plugin
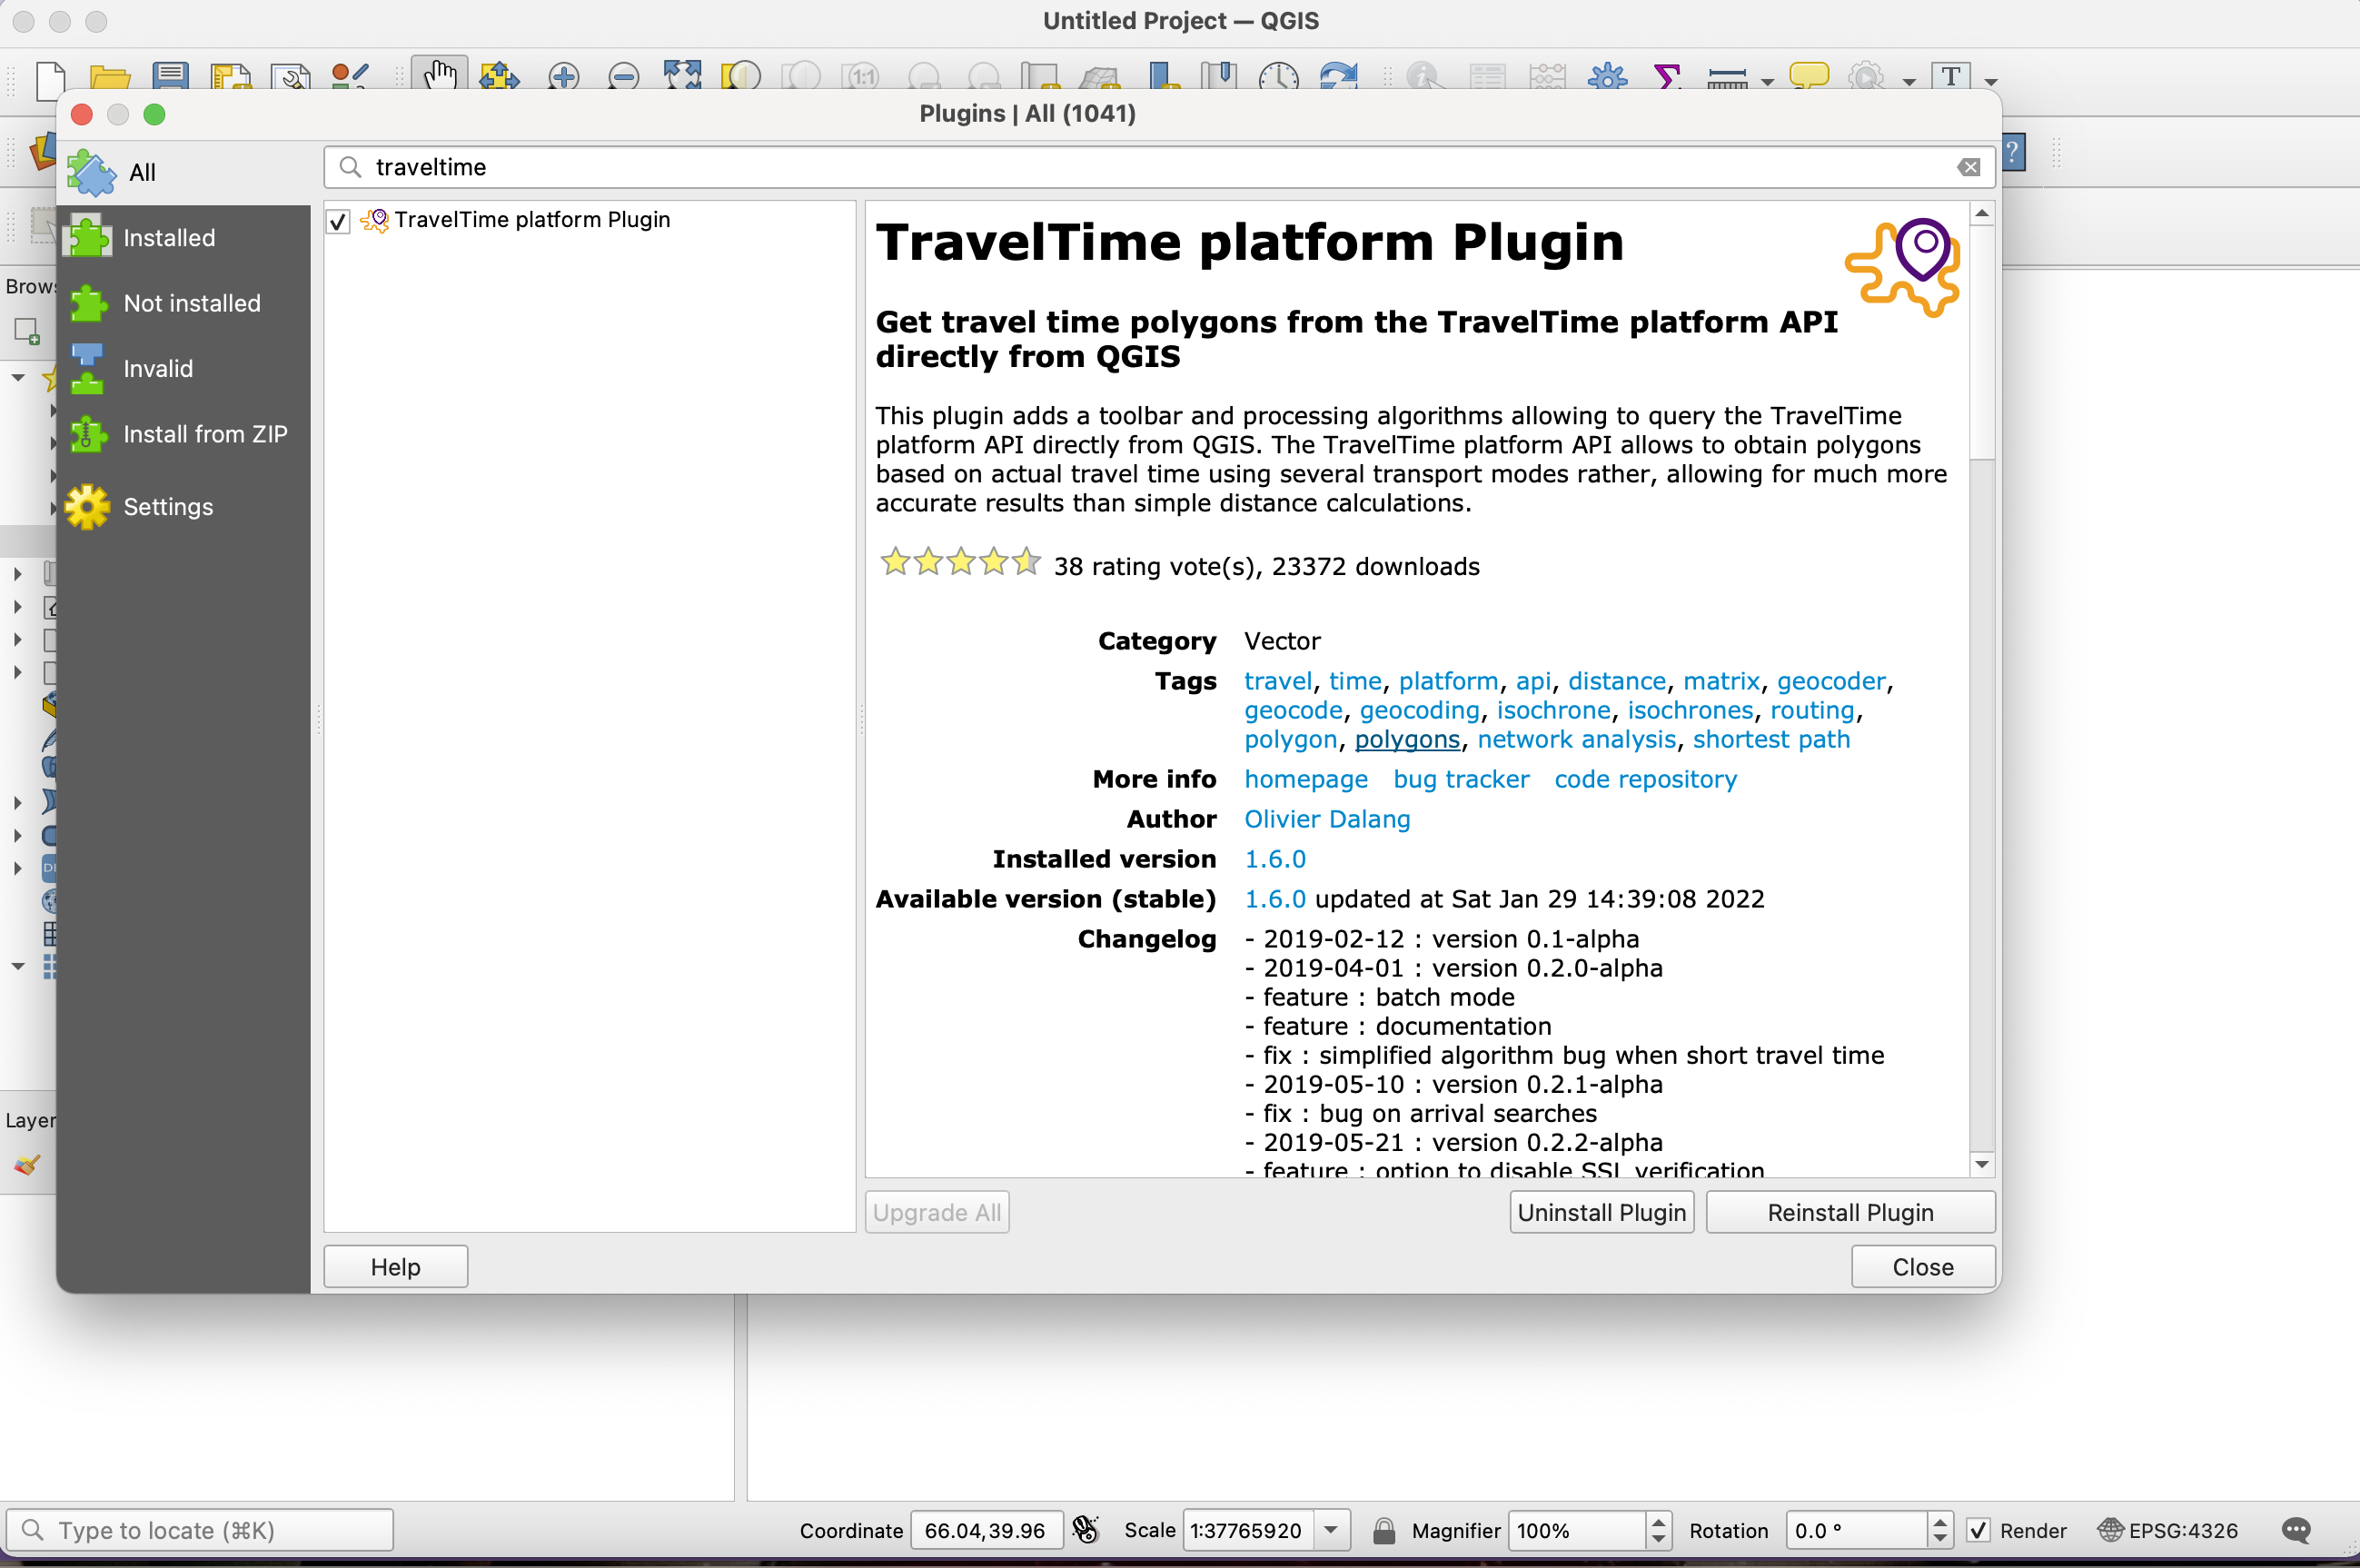
Go into your top menu Plugins > Manage and install plugins. In the All tab, search for “TravelTime” and install the plugin.
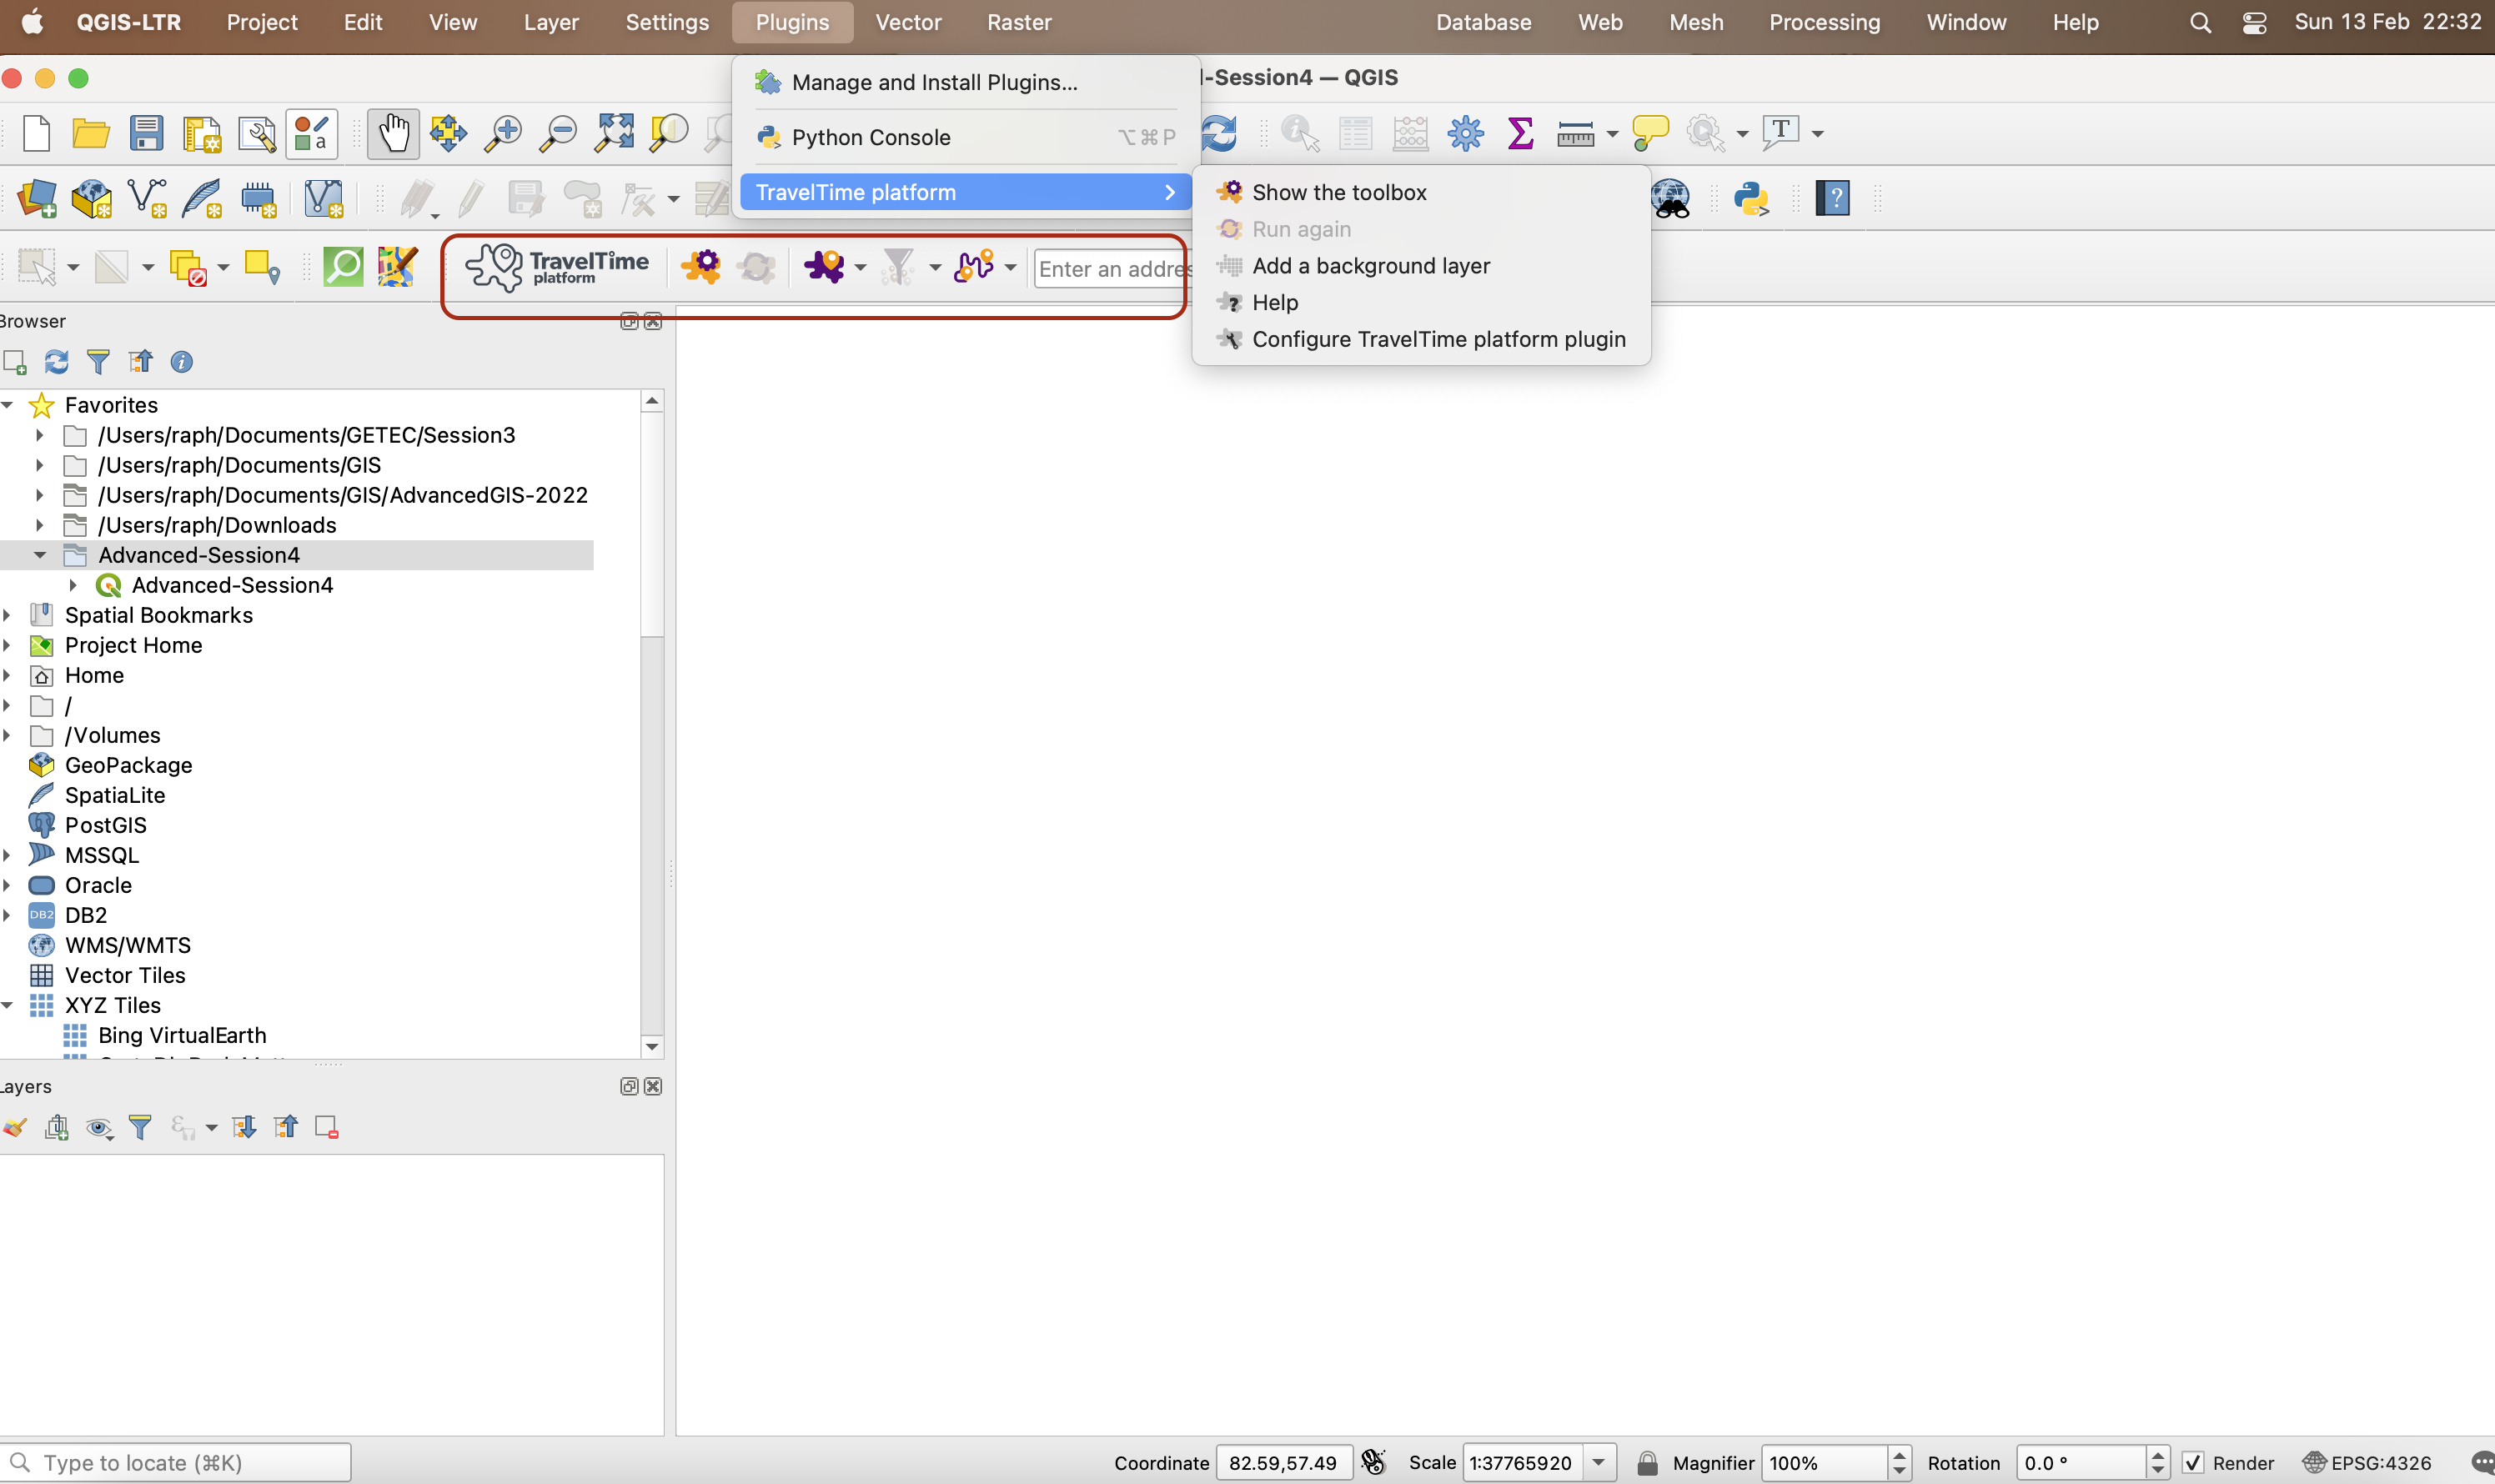
A new toolbar should now have appeared in your top toolbars (if not, you can activate it by going into your top menu View > Toolbars then checking the box in front of TravelTime platform Toolbar). The plugin is also accessible from your top menu Plugins.
3.2 Activate your API Key
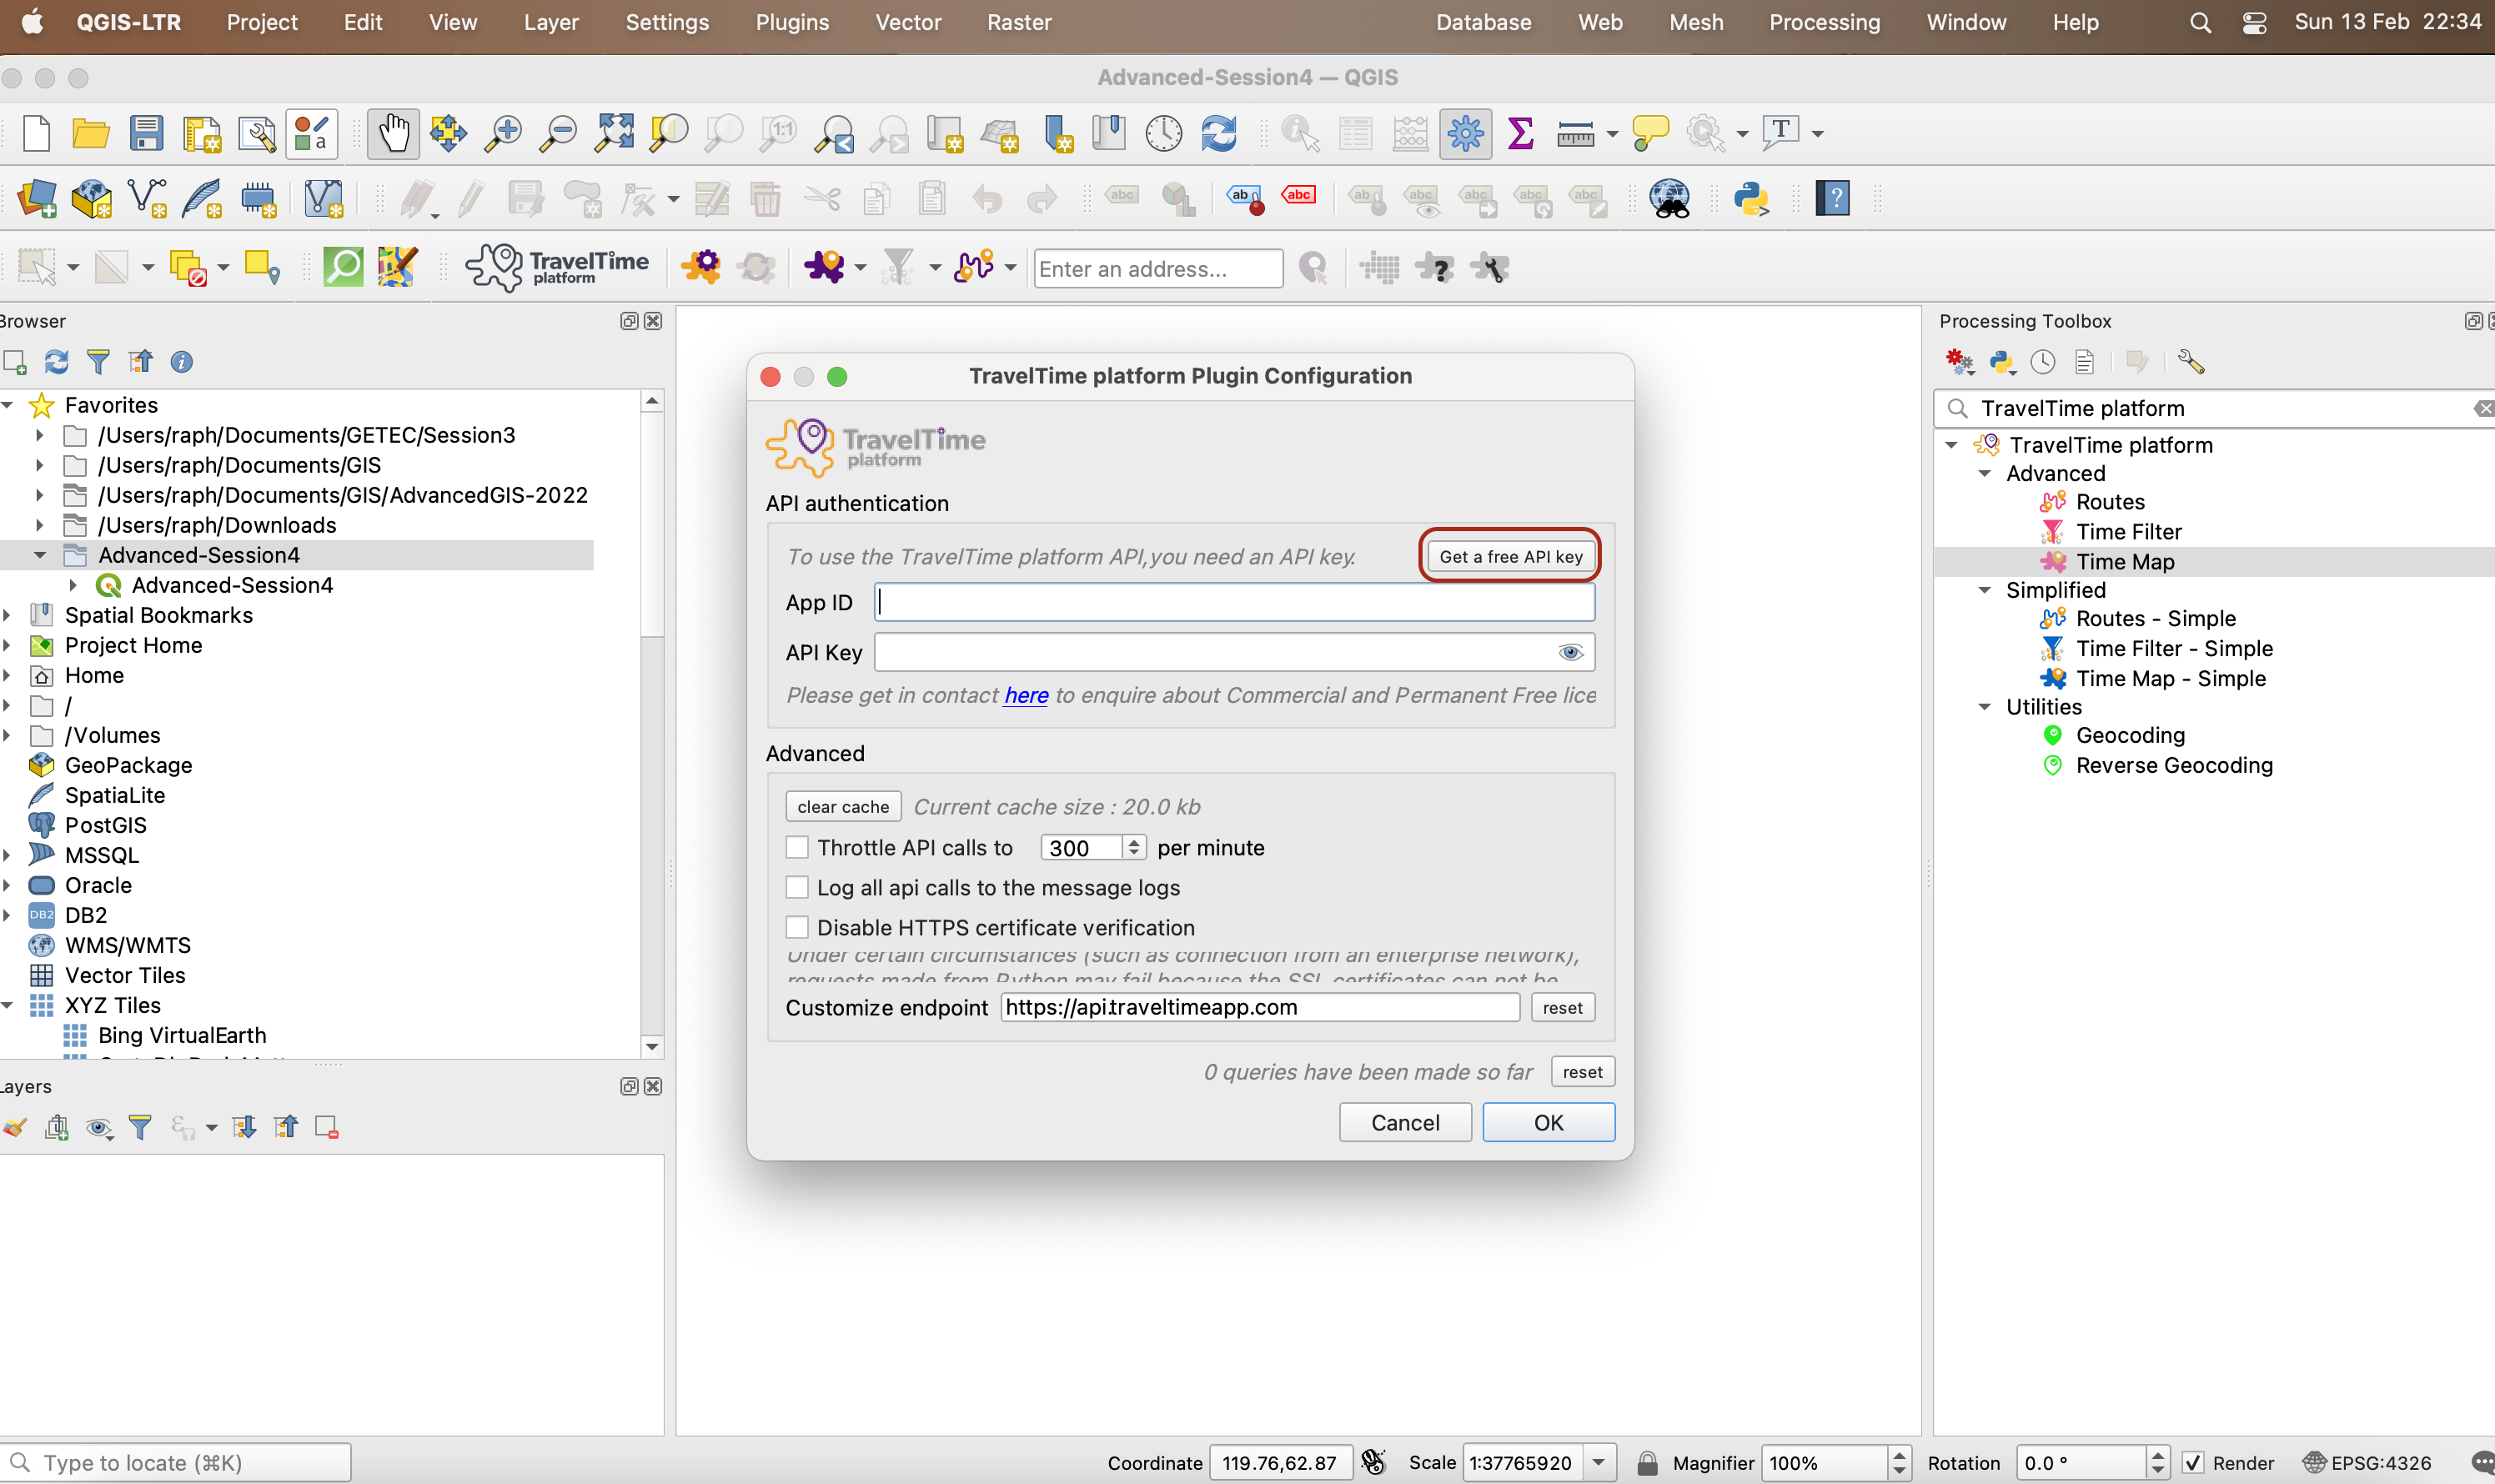
Now, click on the Configuration button. You may get a pop-up message about a master password; set a password and remember it as it may be asked to you from time to time. Next, you should then get this window. In order for TravelTime to function properly, you need to connect to their database using their API. Click on Get a free API Key and you will be taken to this page to register.
Provide your Name, mail address and indicate Sciences Po as company. Create a password for your account then verify the email that was sent to you. You can now login using yoru email address and password, and you will be taken to this page:

Copy the application ID and paste it into that TravelTime window in QGIS, and do the same with the API Key. You can then click OK, and you are now ready to use the plugin.
IV. Isochrones and time filters
4.1 Creating a simple isochrone
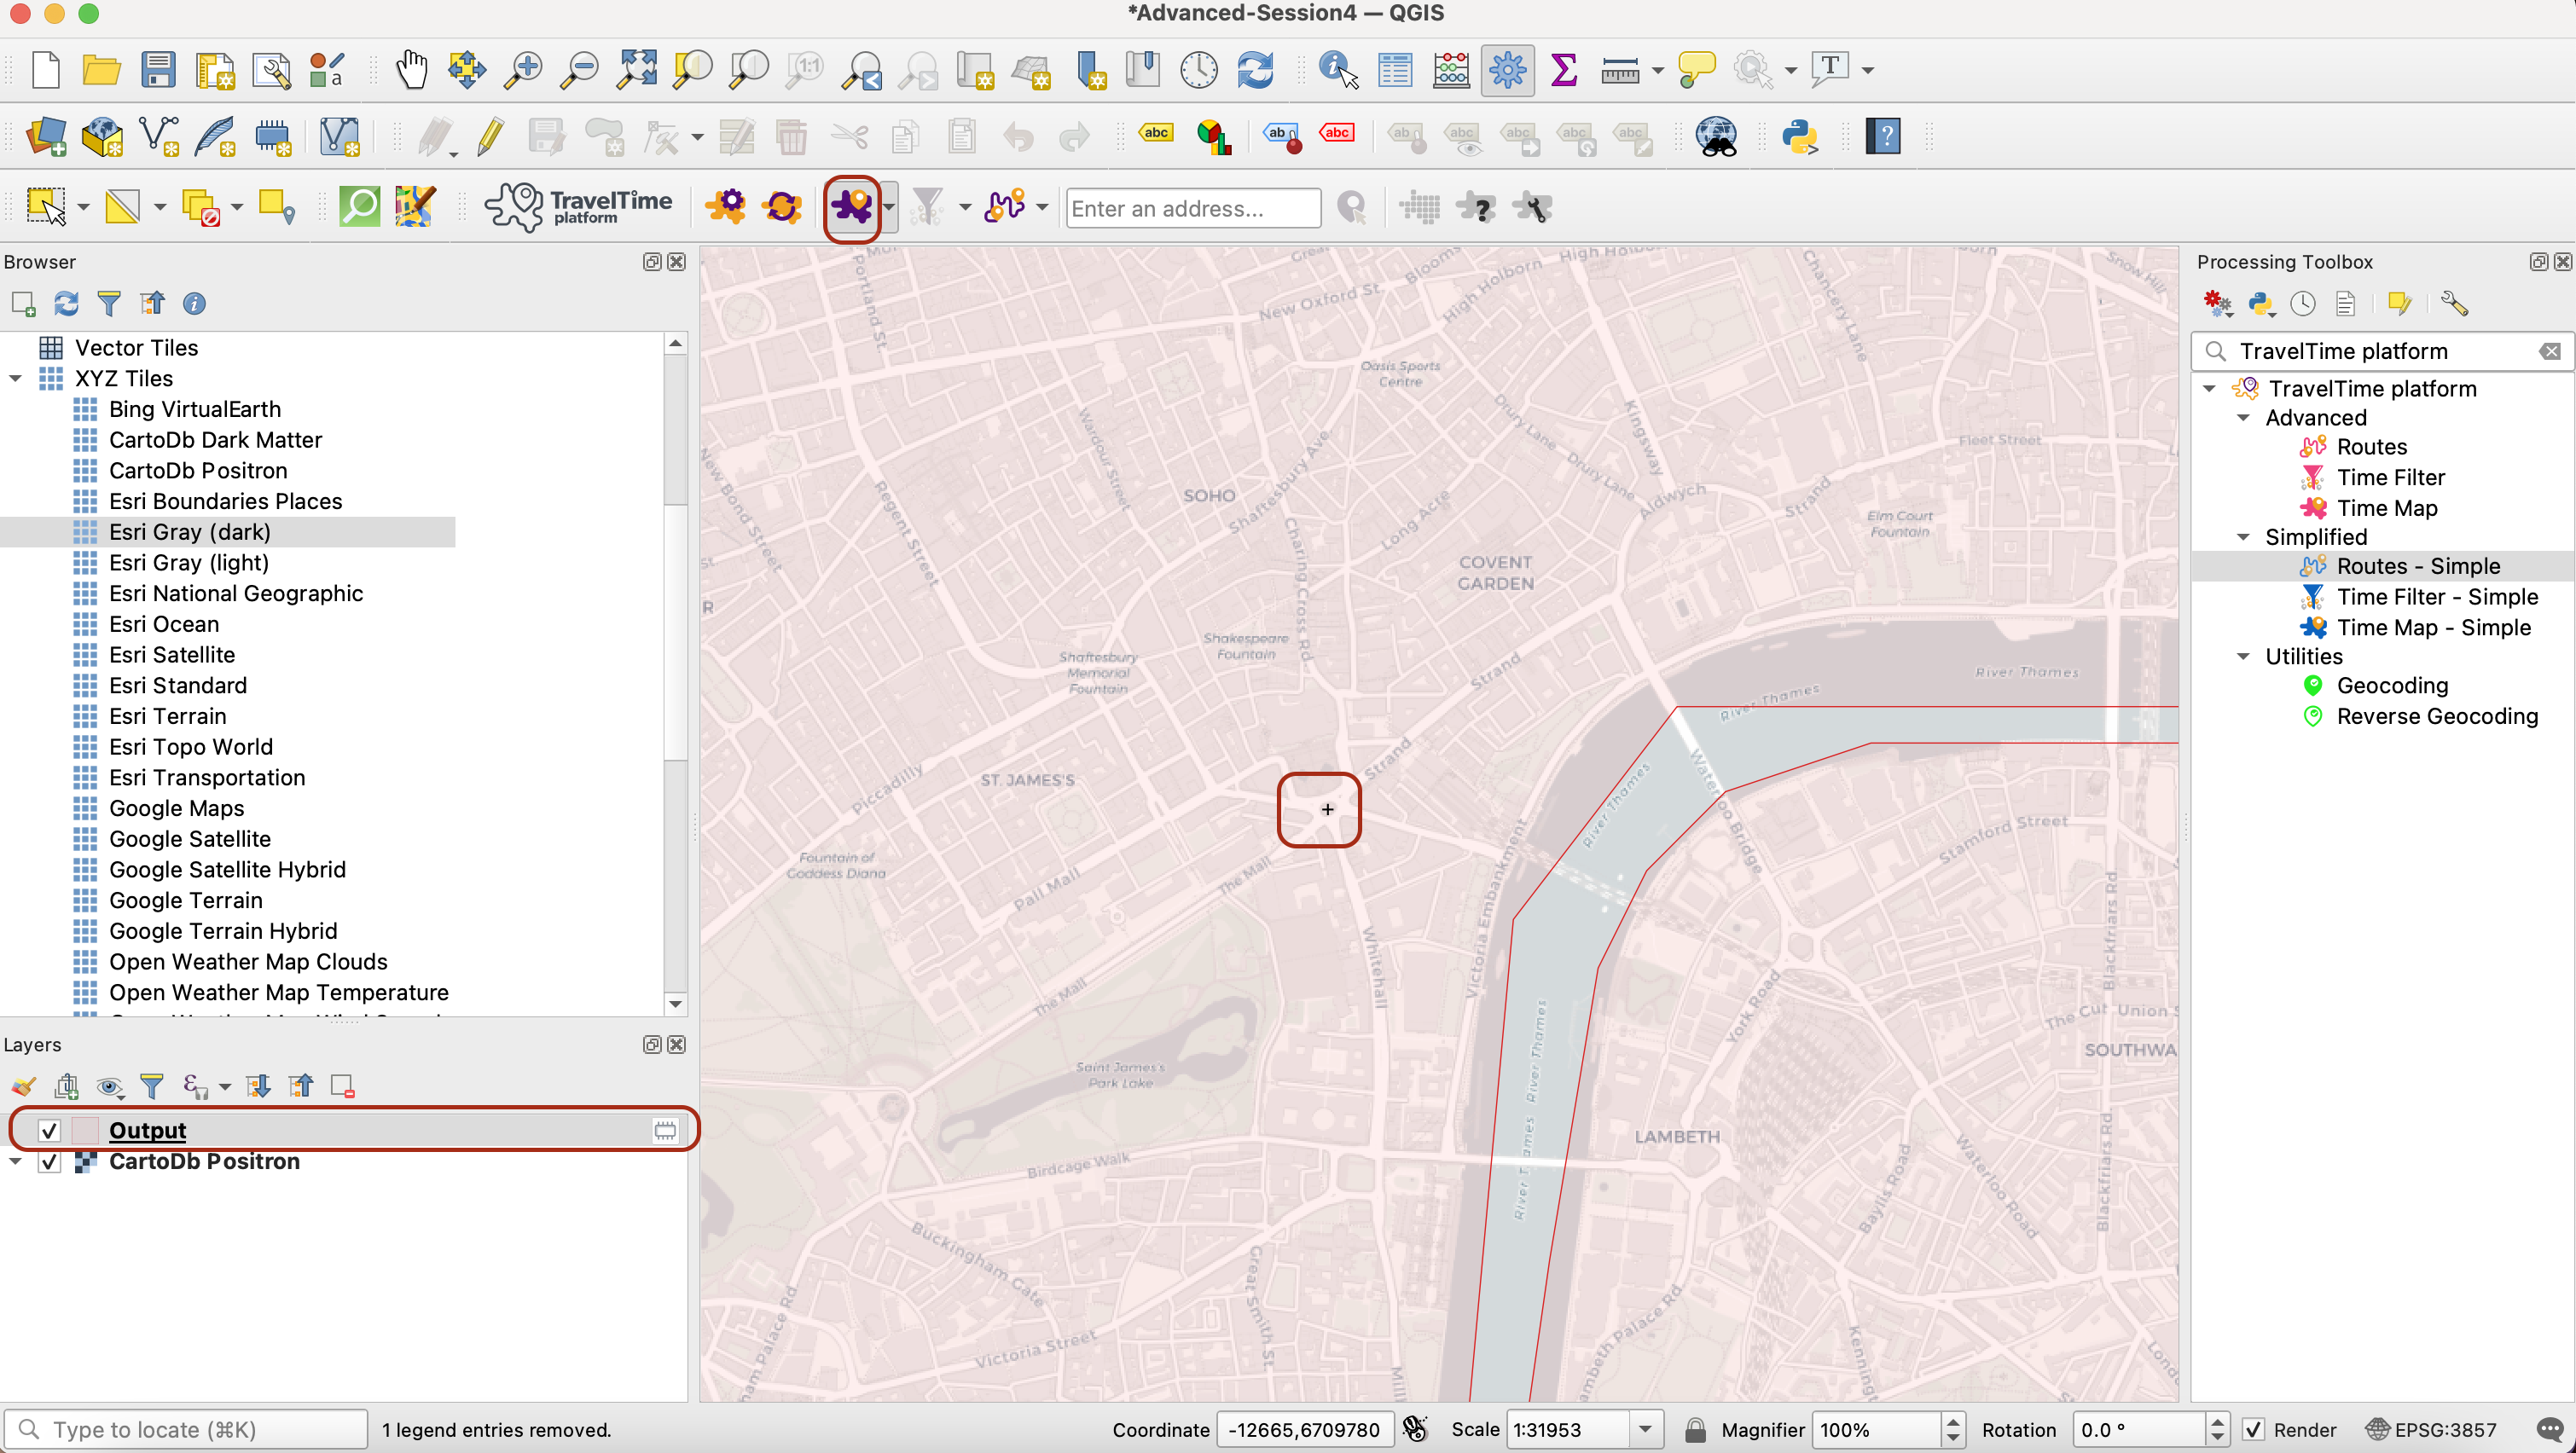
Let’s use the quick time map functionality of TravelTime. Find a point of interest, for instance Trafalgar Square, and center your canvas around that area. Now click on the small down arrow by the Quick Time Map icon. You can select the mode of transportation (public transport, cycling, walking or driving), a duration of travel, and a departure or arrival time.
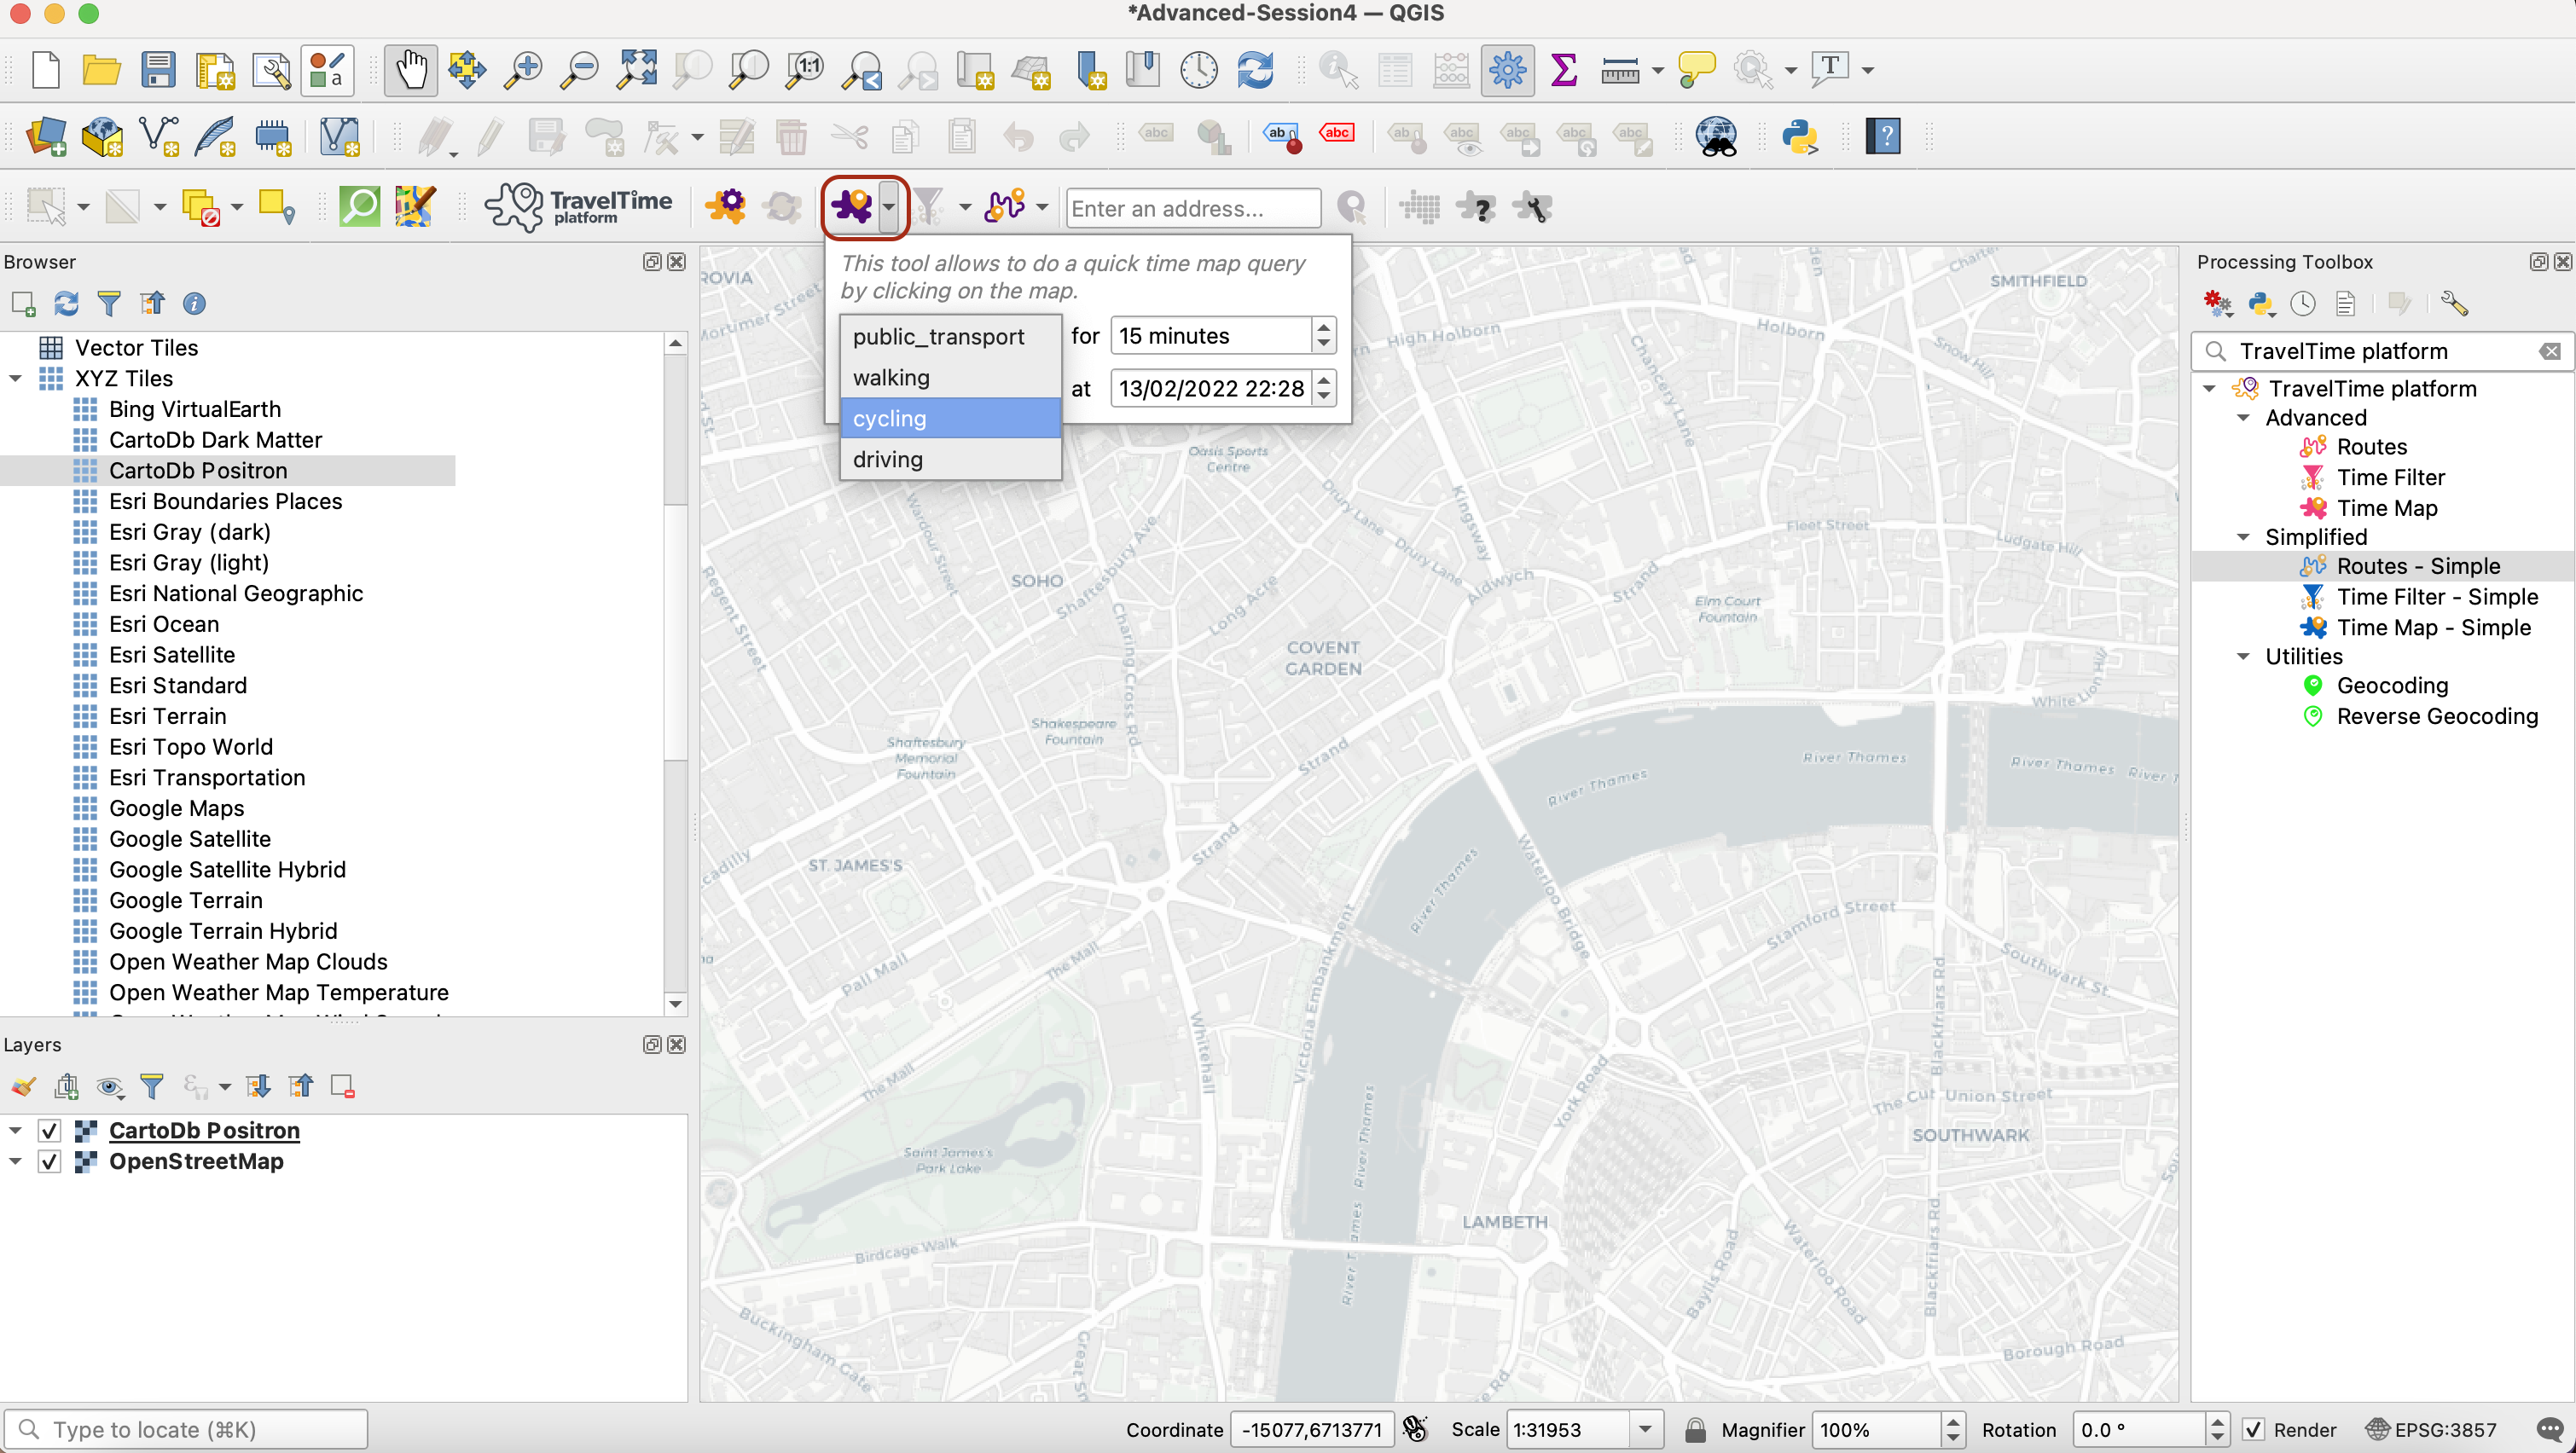
You can select for instance 15 minutes cycling and leave the departure time parameters unchanged. Now click on the actual icon, and your mouse cursor will turn into a black cross on your map canvas. Once you click anywhere on the canvas, an isochrone of all areas accessible within 15 minutes cycling of that point will be drawn and added to your layer list.
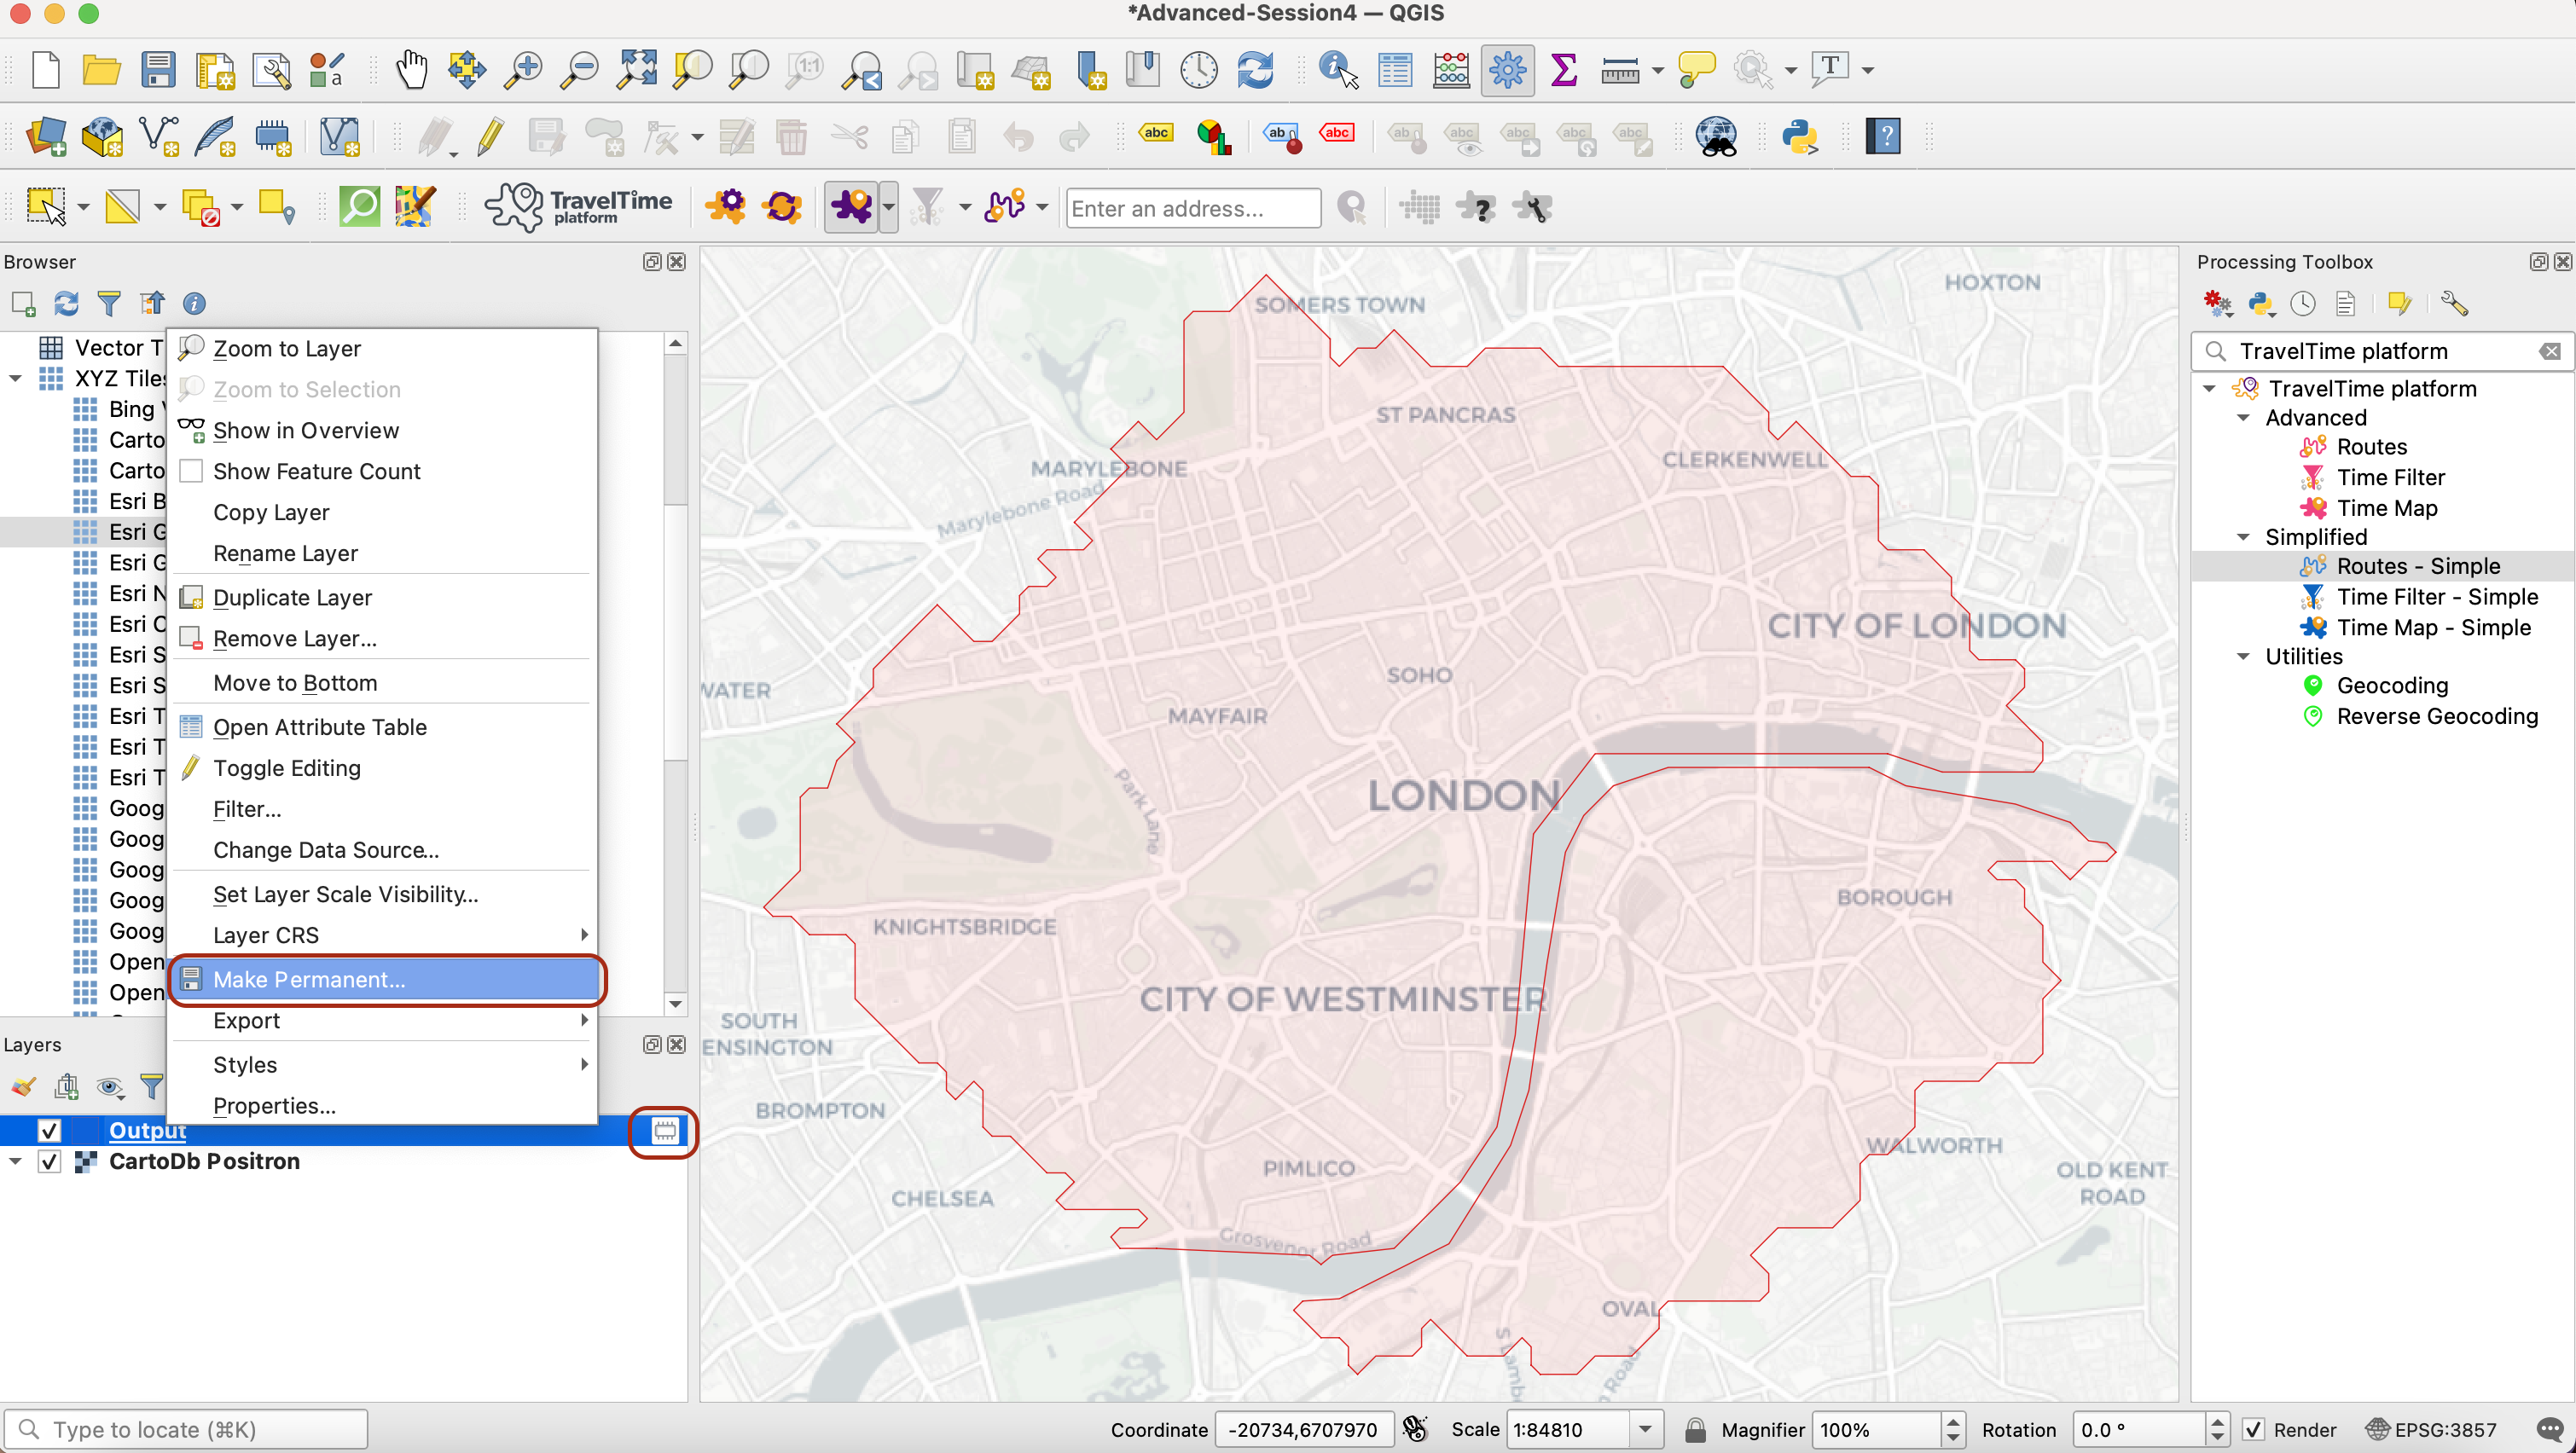
Zoom out to get a sense of the coverage of that isochrone. Notice that this new layer is only a scratch layer; if you want to save it you need to right click that layer > Make Permanent and save it in a new geopackage.
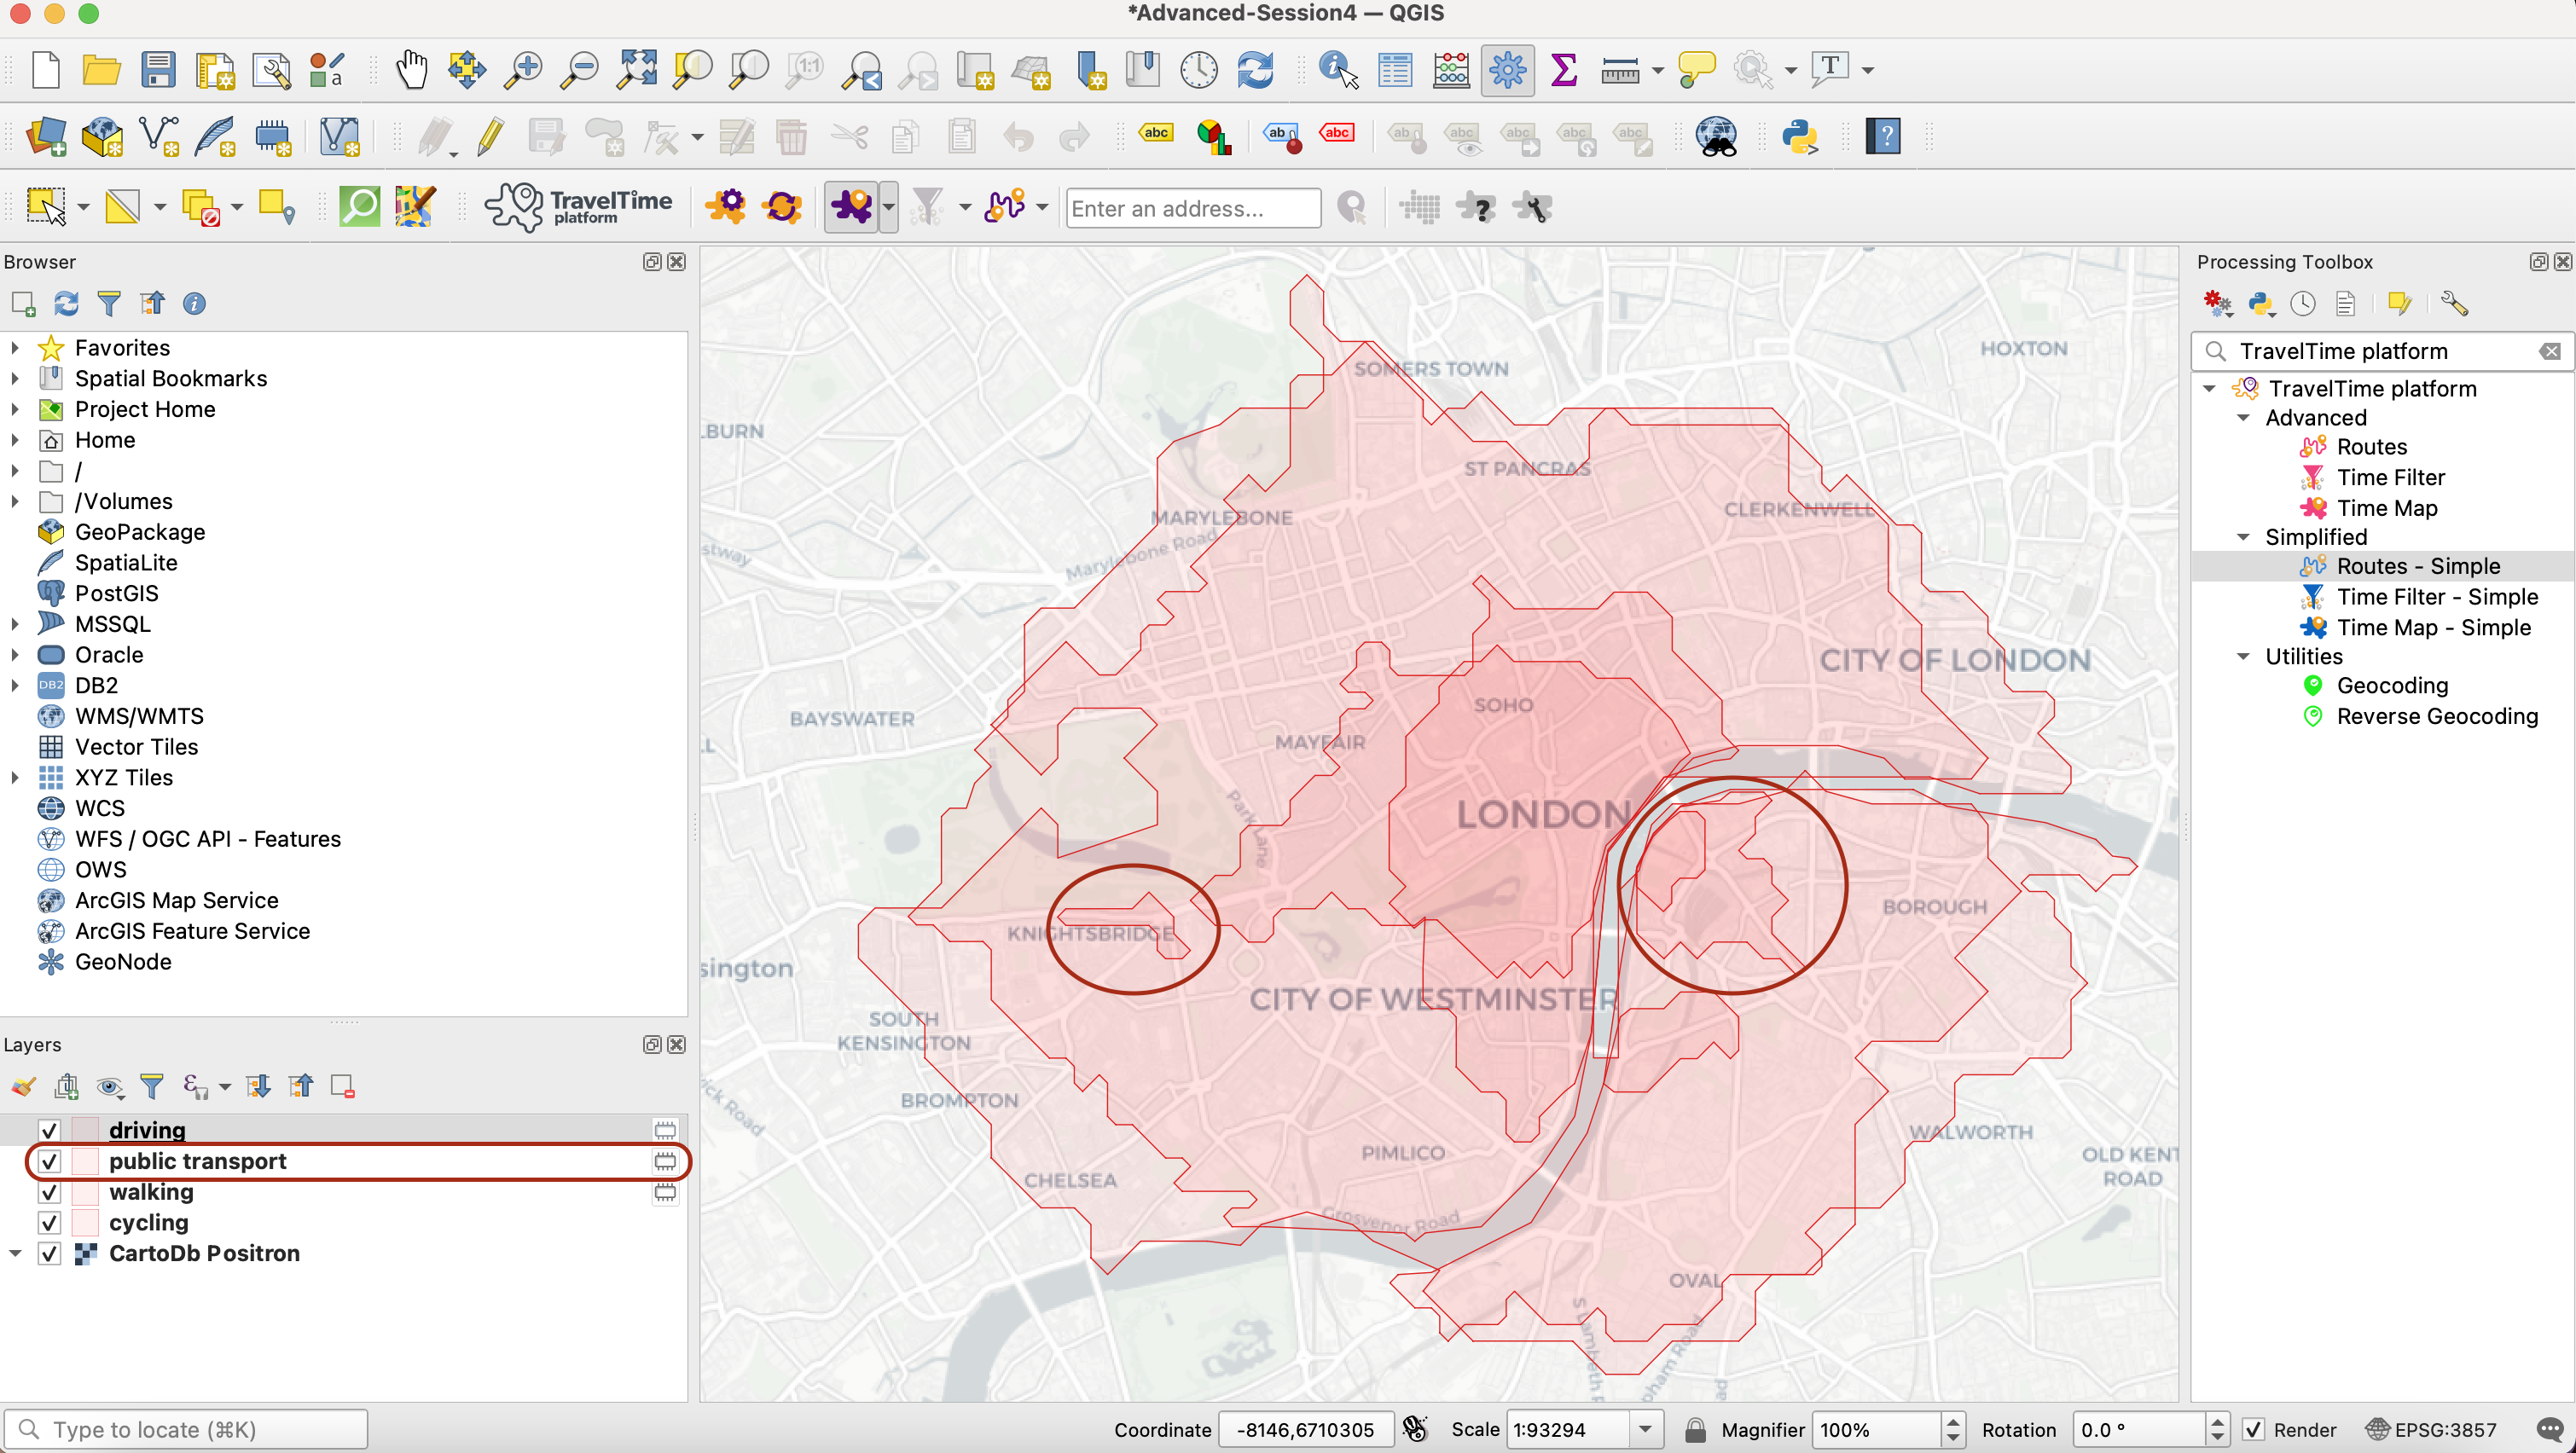
You can click on the QuickTimeMap icon again and click on a different point to generate a new isochrone. Try using a single starting point and different modes of transportation (you can rename the layers that are being generated, to keep track). Toggle the layers on and off to compare the outputs. Notice that with public transport, little islands tend to appear at tube/train stations that are connected to your point of departure.
4.2 Generating an itinerary
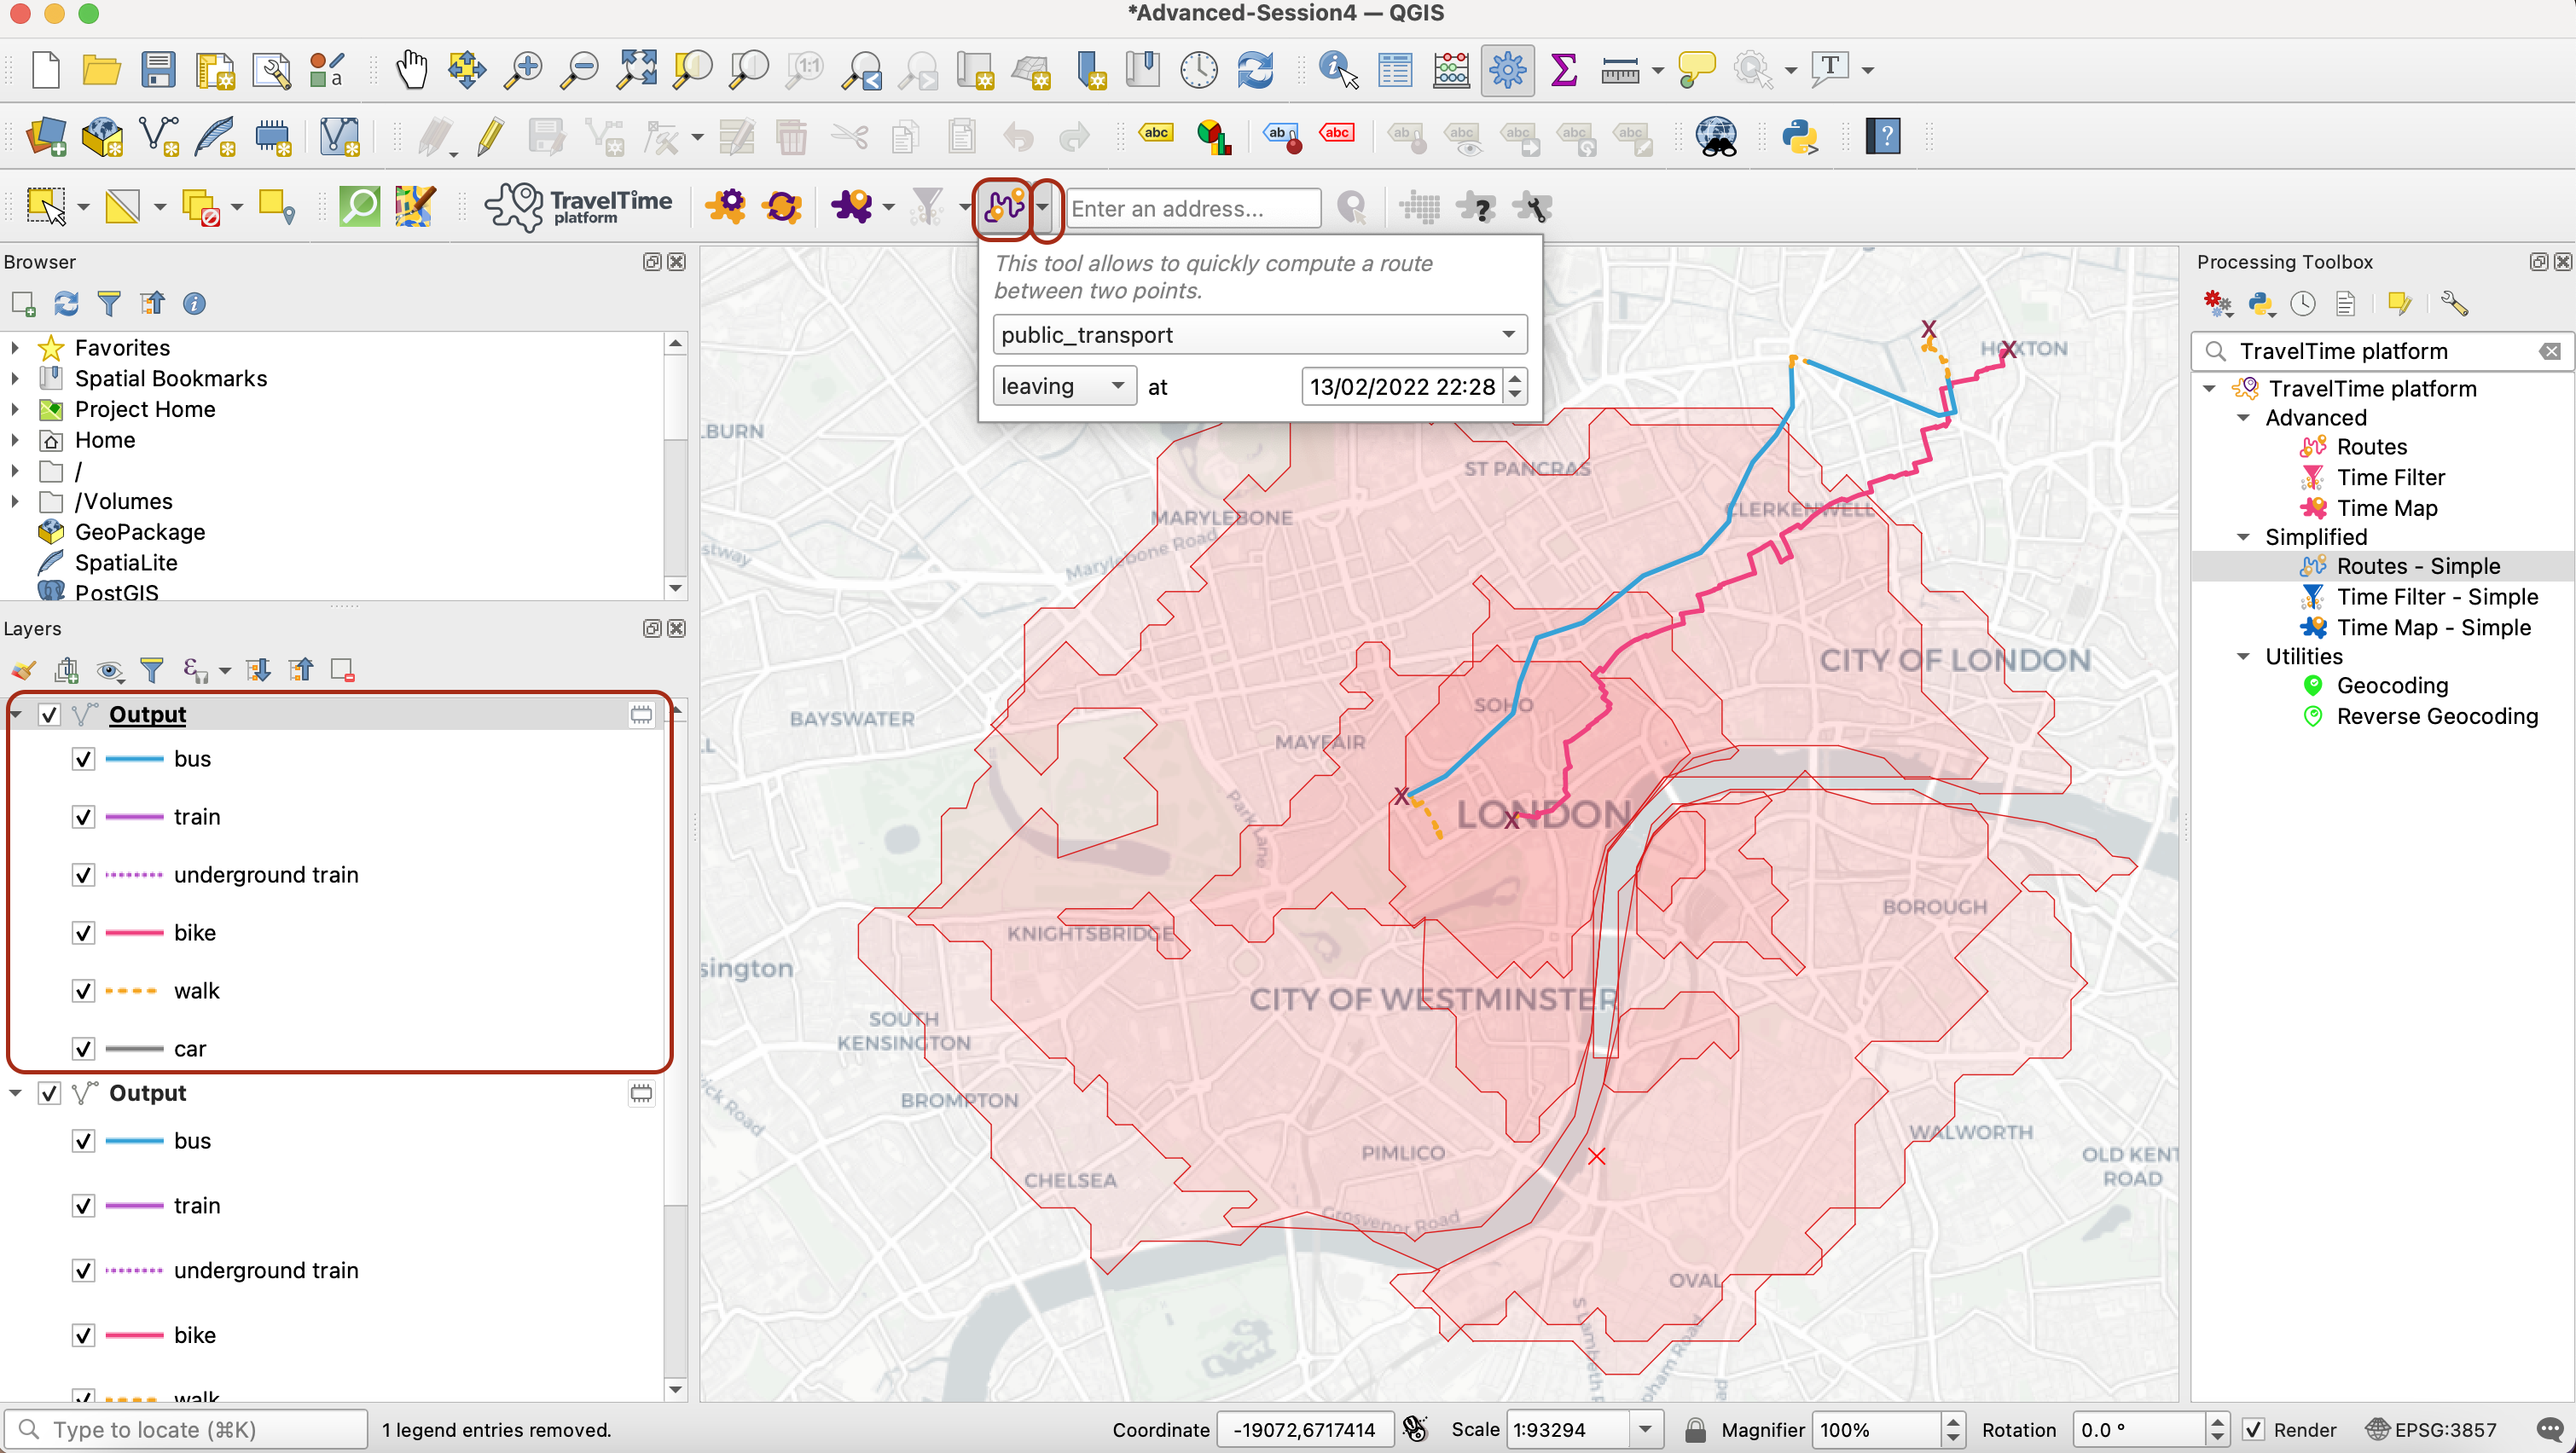
Another functionality in TravelTime is to generate best itineraries from a point A to a point B. You can try it by using the down arrow to define your settings (time of departure/arrival and mode of transportation), then clicking on the actual Quick route icon and clicking the departure and arrival points on your map canvas. This automatically generates a pre-styled polyline that describes each step of the itinerary, (a bit like Citymapper or Google Maps directions).
V. Filtering point data based on travel time
We now want to find out, within our 15min cycling isochrone from Trafalgar Square, whether there are any theatres accessible within 10 minutes walk of Trafalgar square. We will then check which art centres are within another 10 minute cycle from any of these pre-selected theatres.
5.1 Get the point data
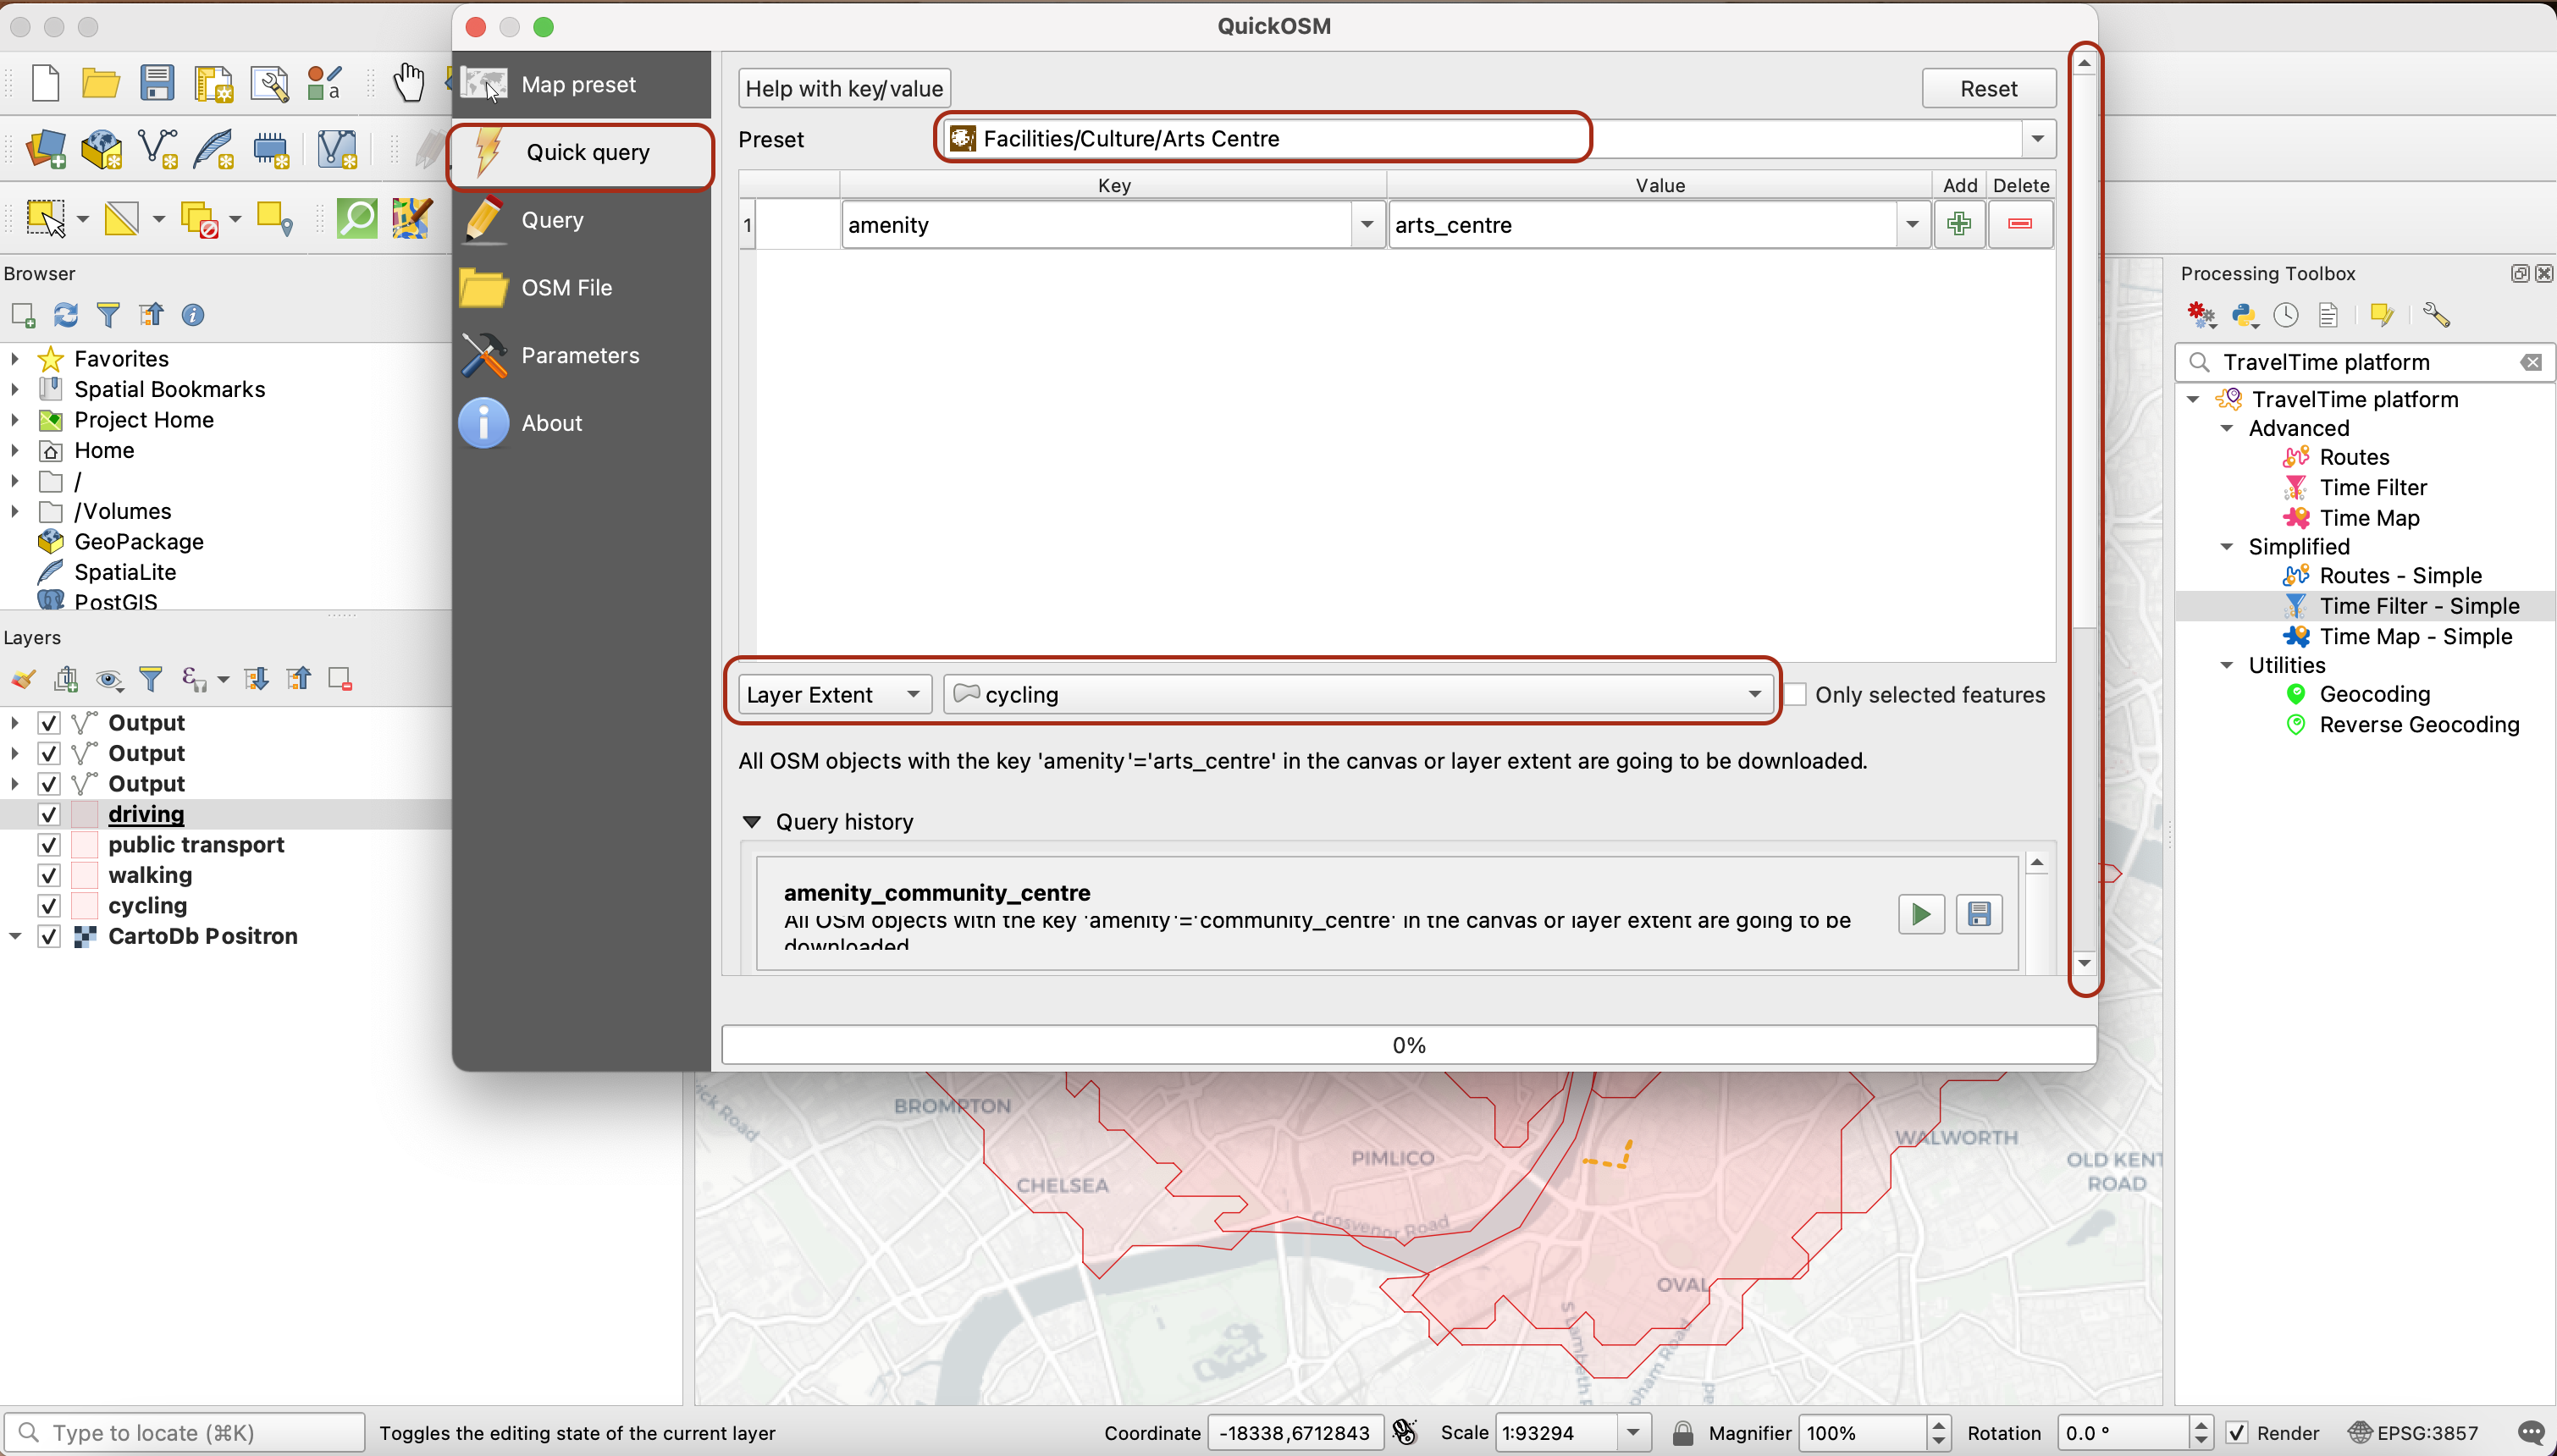
In your vector menu, click QuickOSM > QuickOSM.... If this is not available to you, go to your plugins menu and install QuickOSM. In the Quick Query menu, type “arts” in the preset box and select Arts Centre. For the query extent, select Layer Extent and set it to your cycling isochrone. Use the side navigation bar to scroll all the way down and press Run Query.
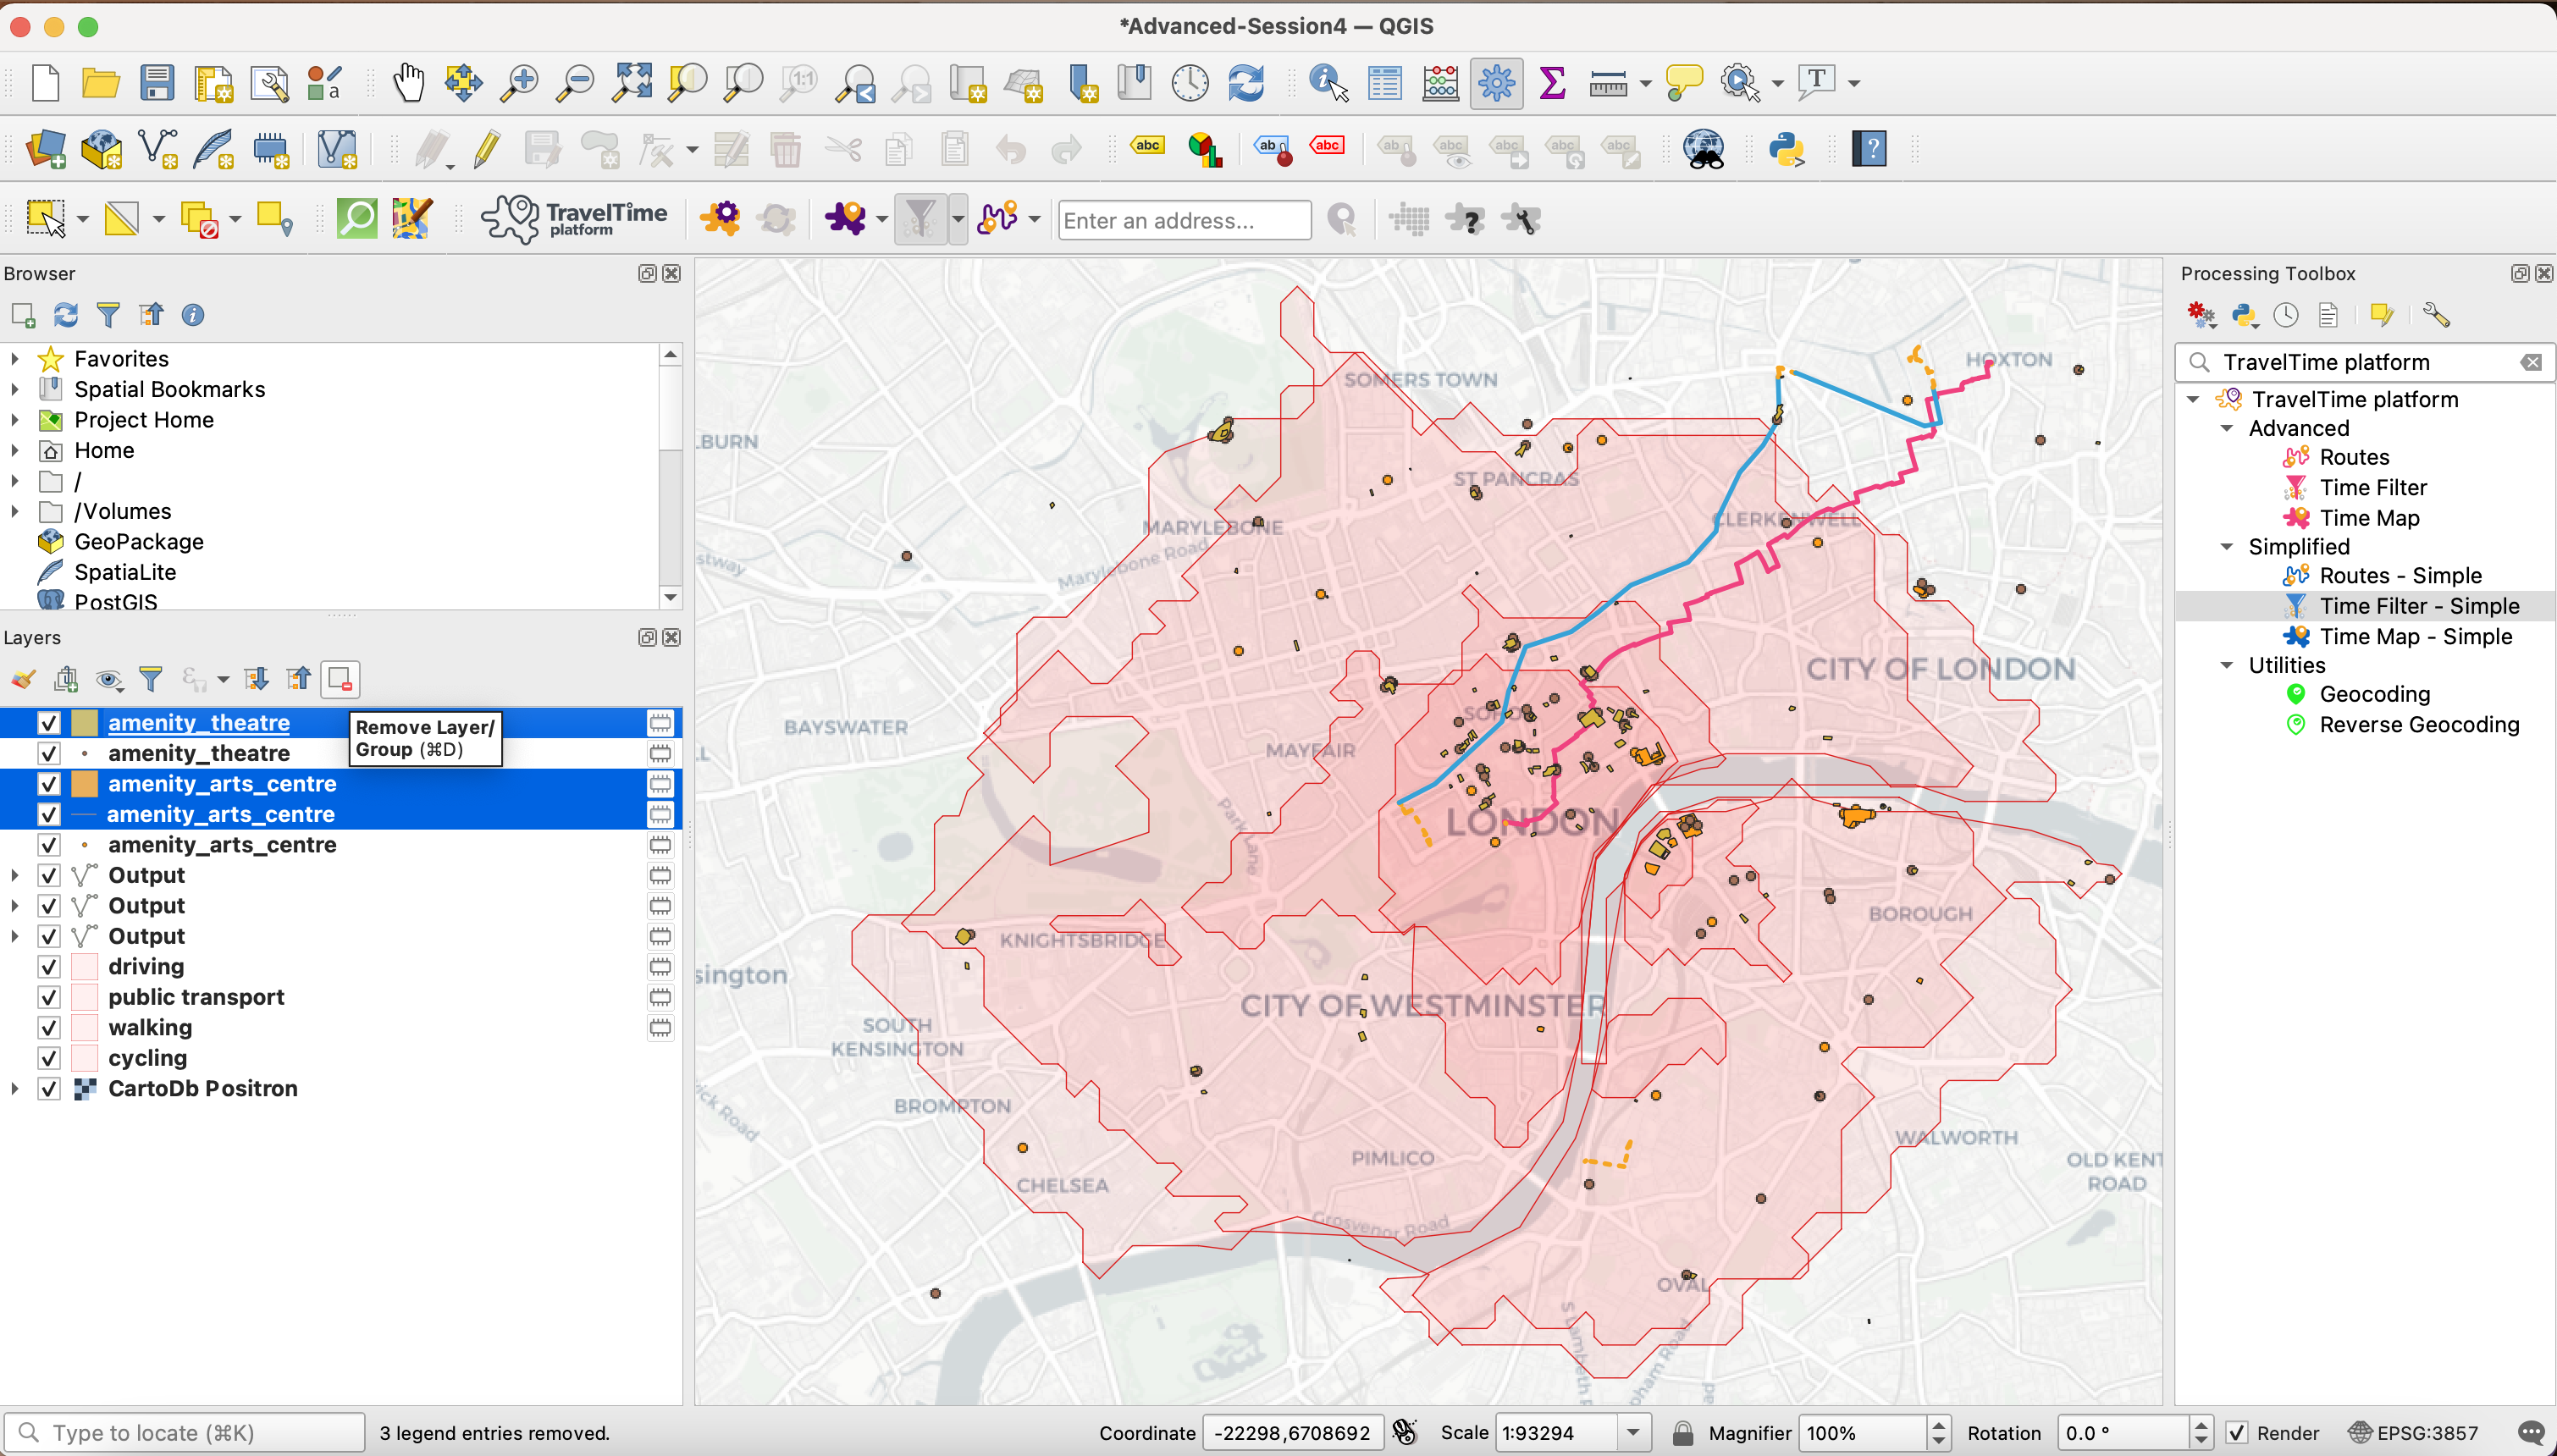
Repeat the operation for “Theatres”, also to the extent of your cycling isochrone. In your Layers panel, only keep the Point layers, remove the lines and polygons.
5.2 Filter arts centres within 10 minutes walk of Trafalgar Square
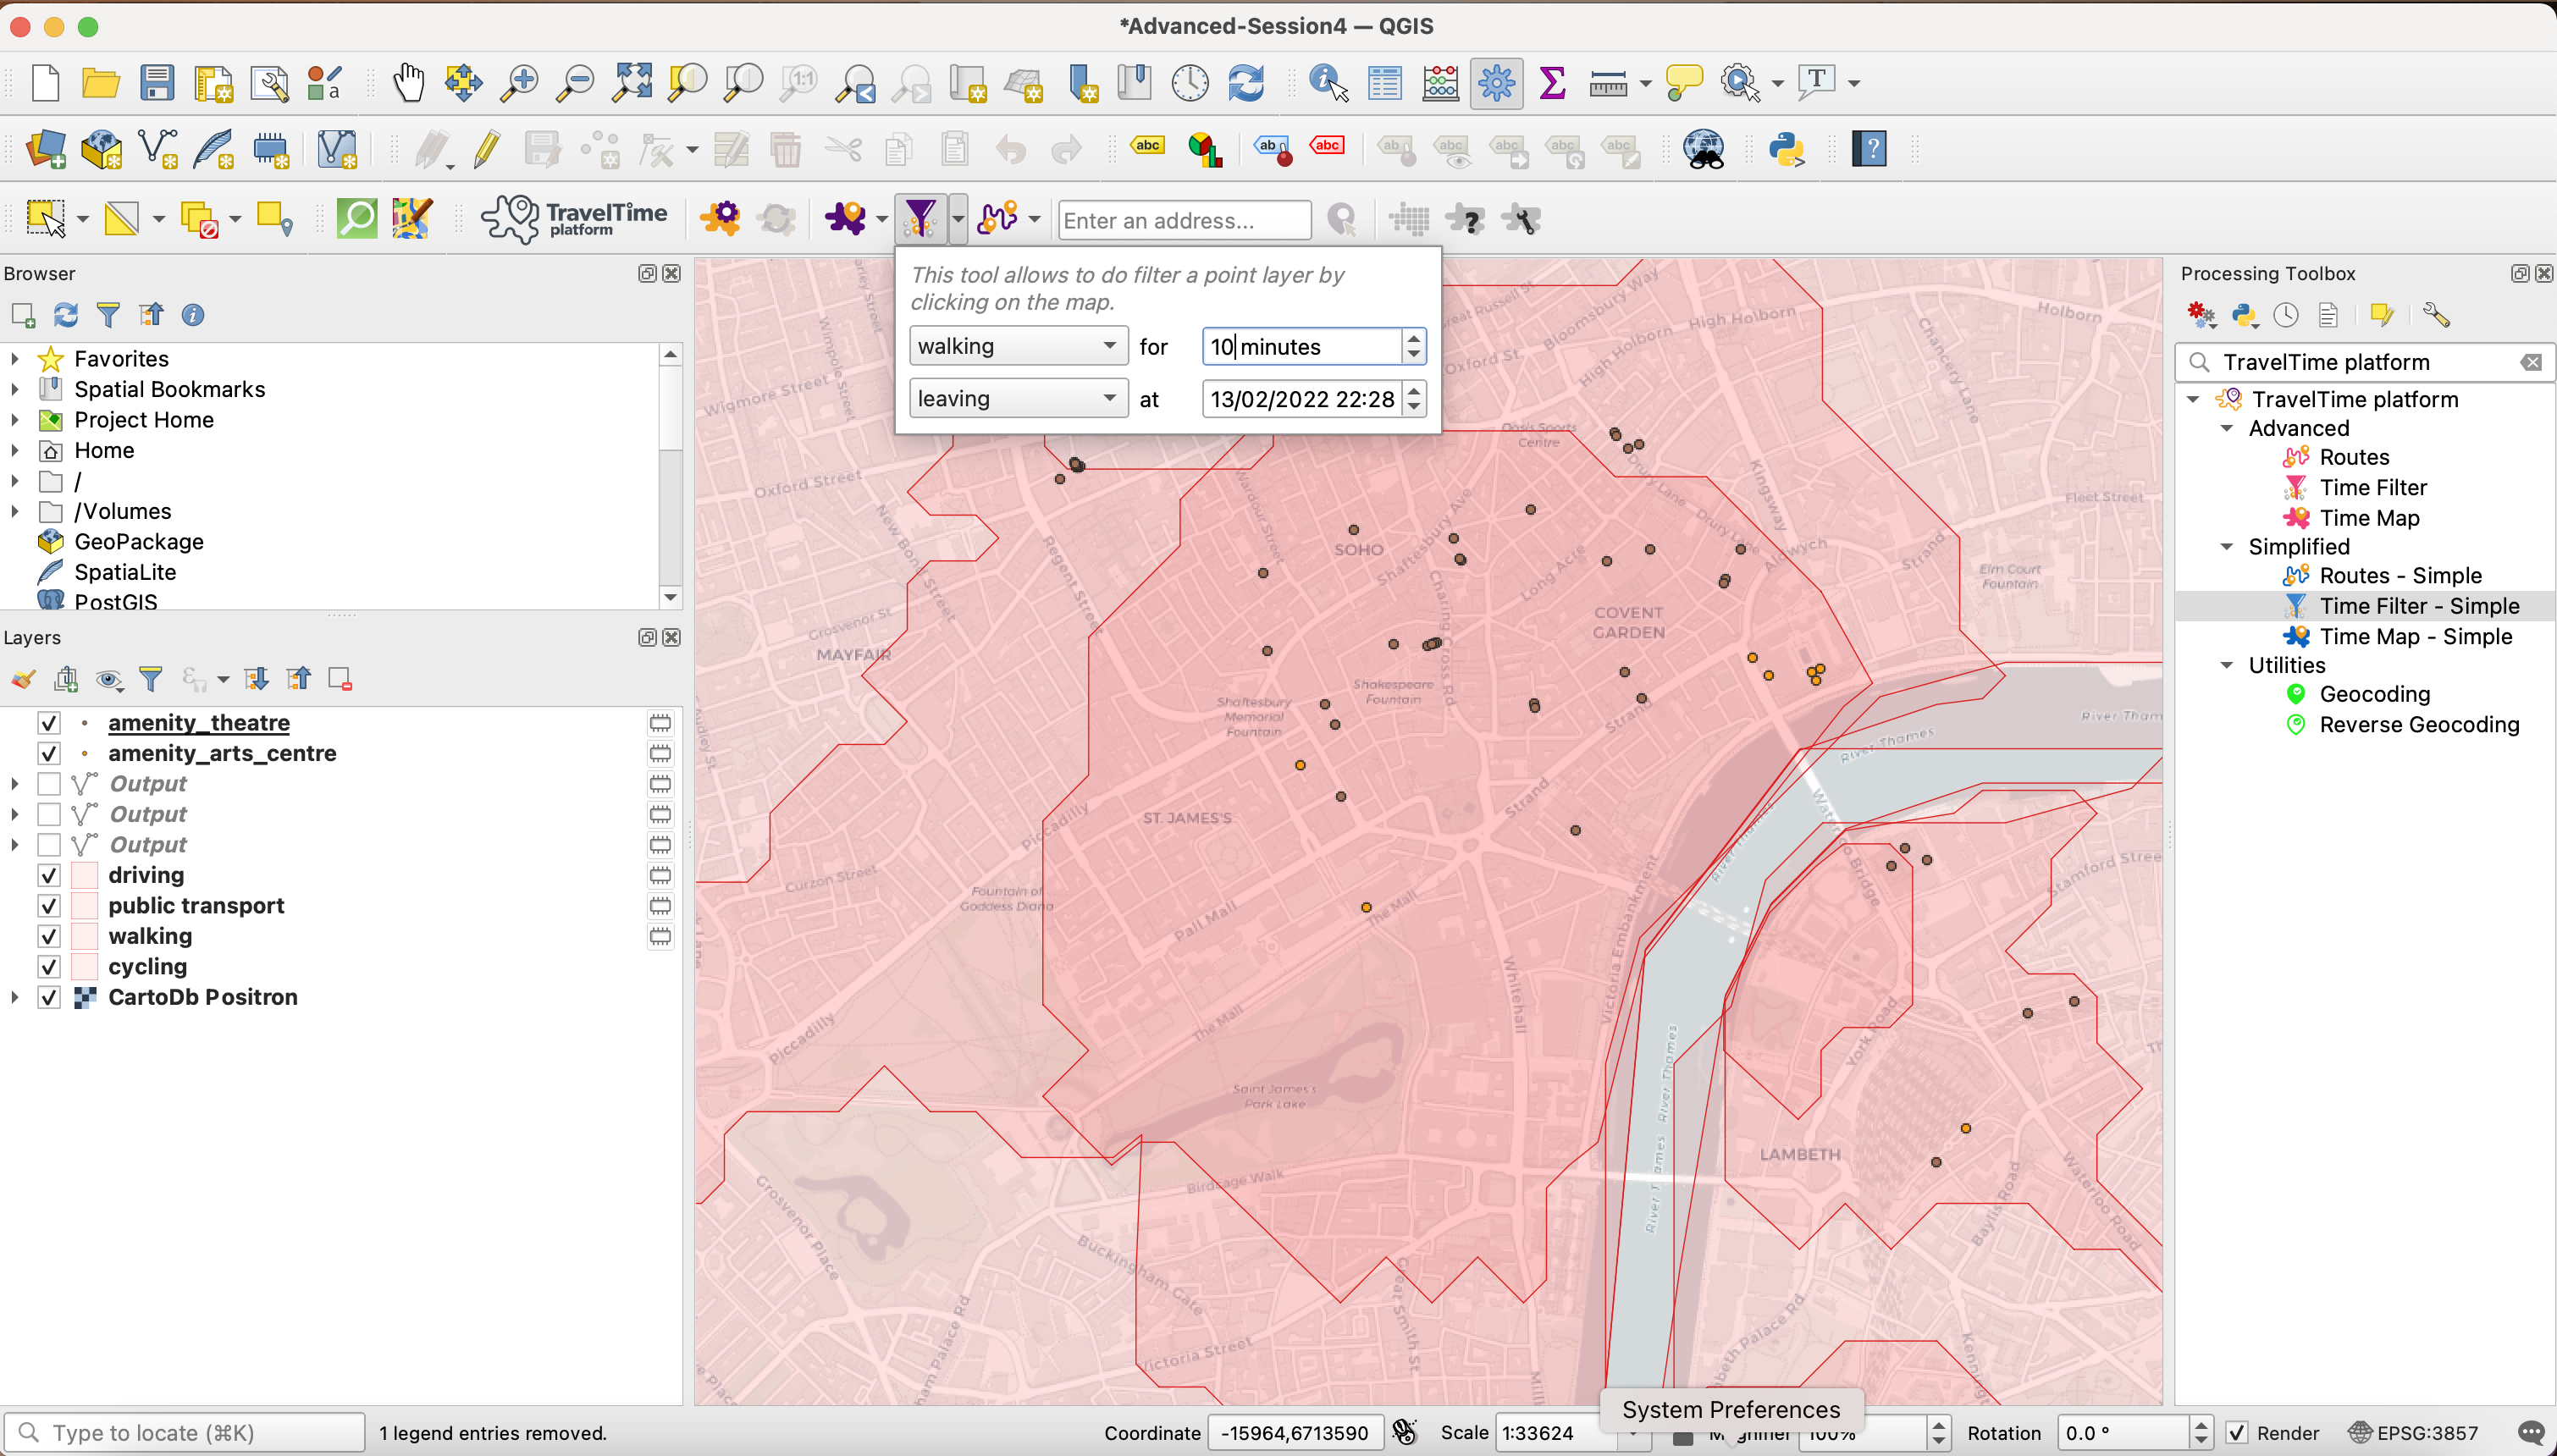
Untick the itinerary layers and zoom in a bit closer onto Trafalgar Square. In your Layers panel, make sure that your amenity_theatre layer is selected. Then move on to the QuickTime filter icon and press the down arrow to specify your filter criteria: 10minutes walk.
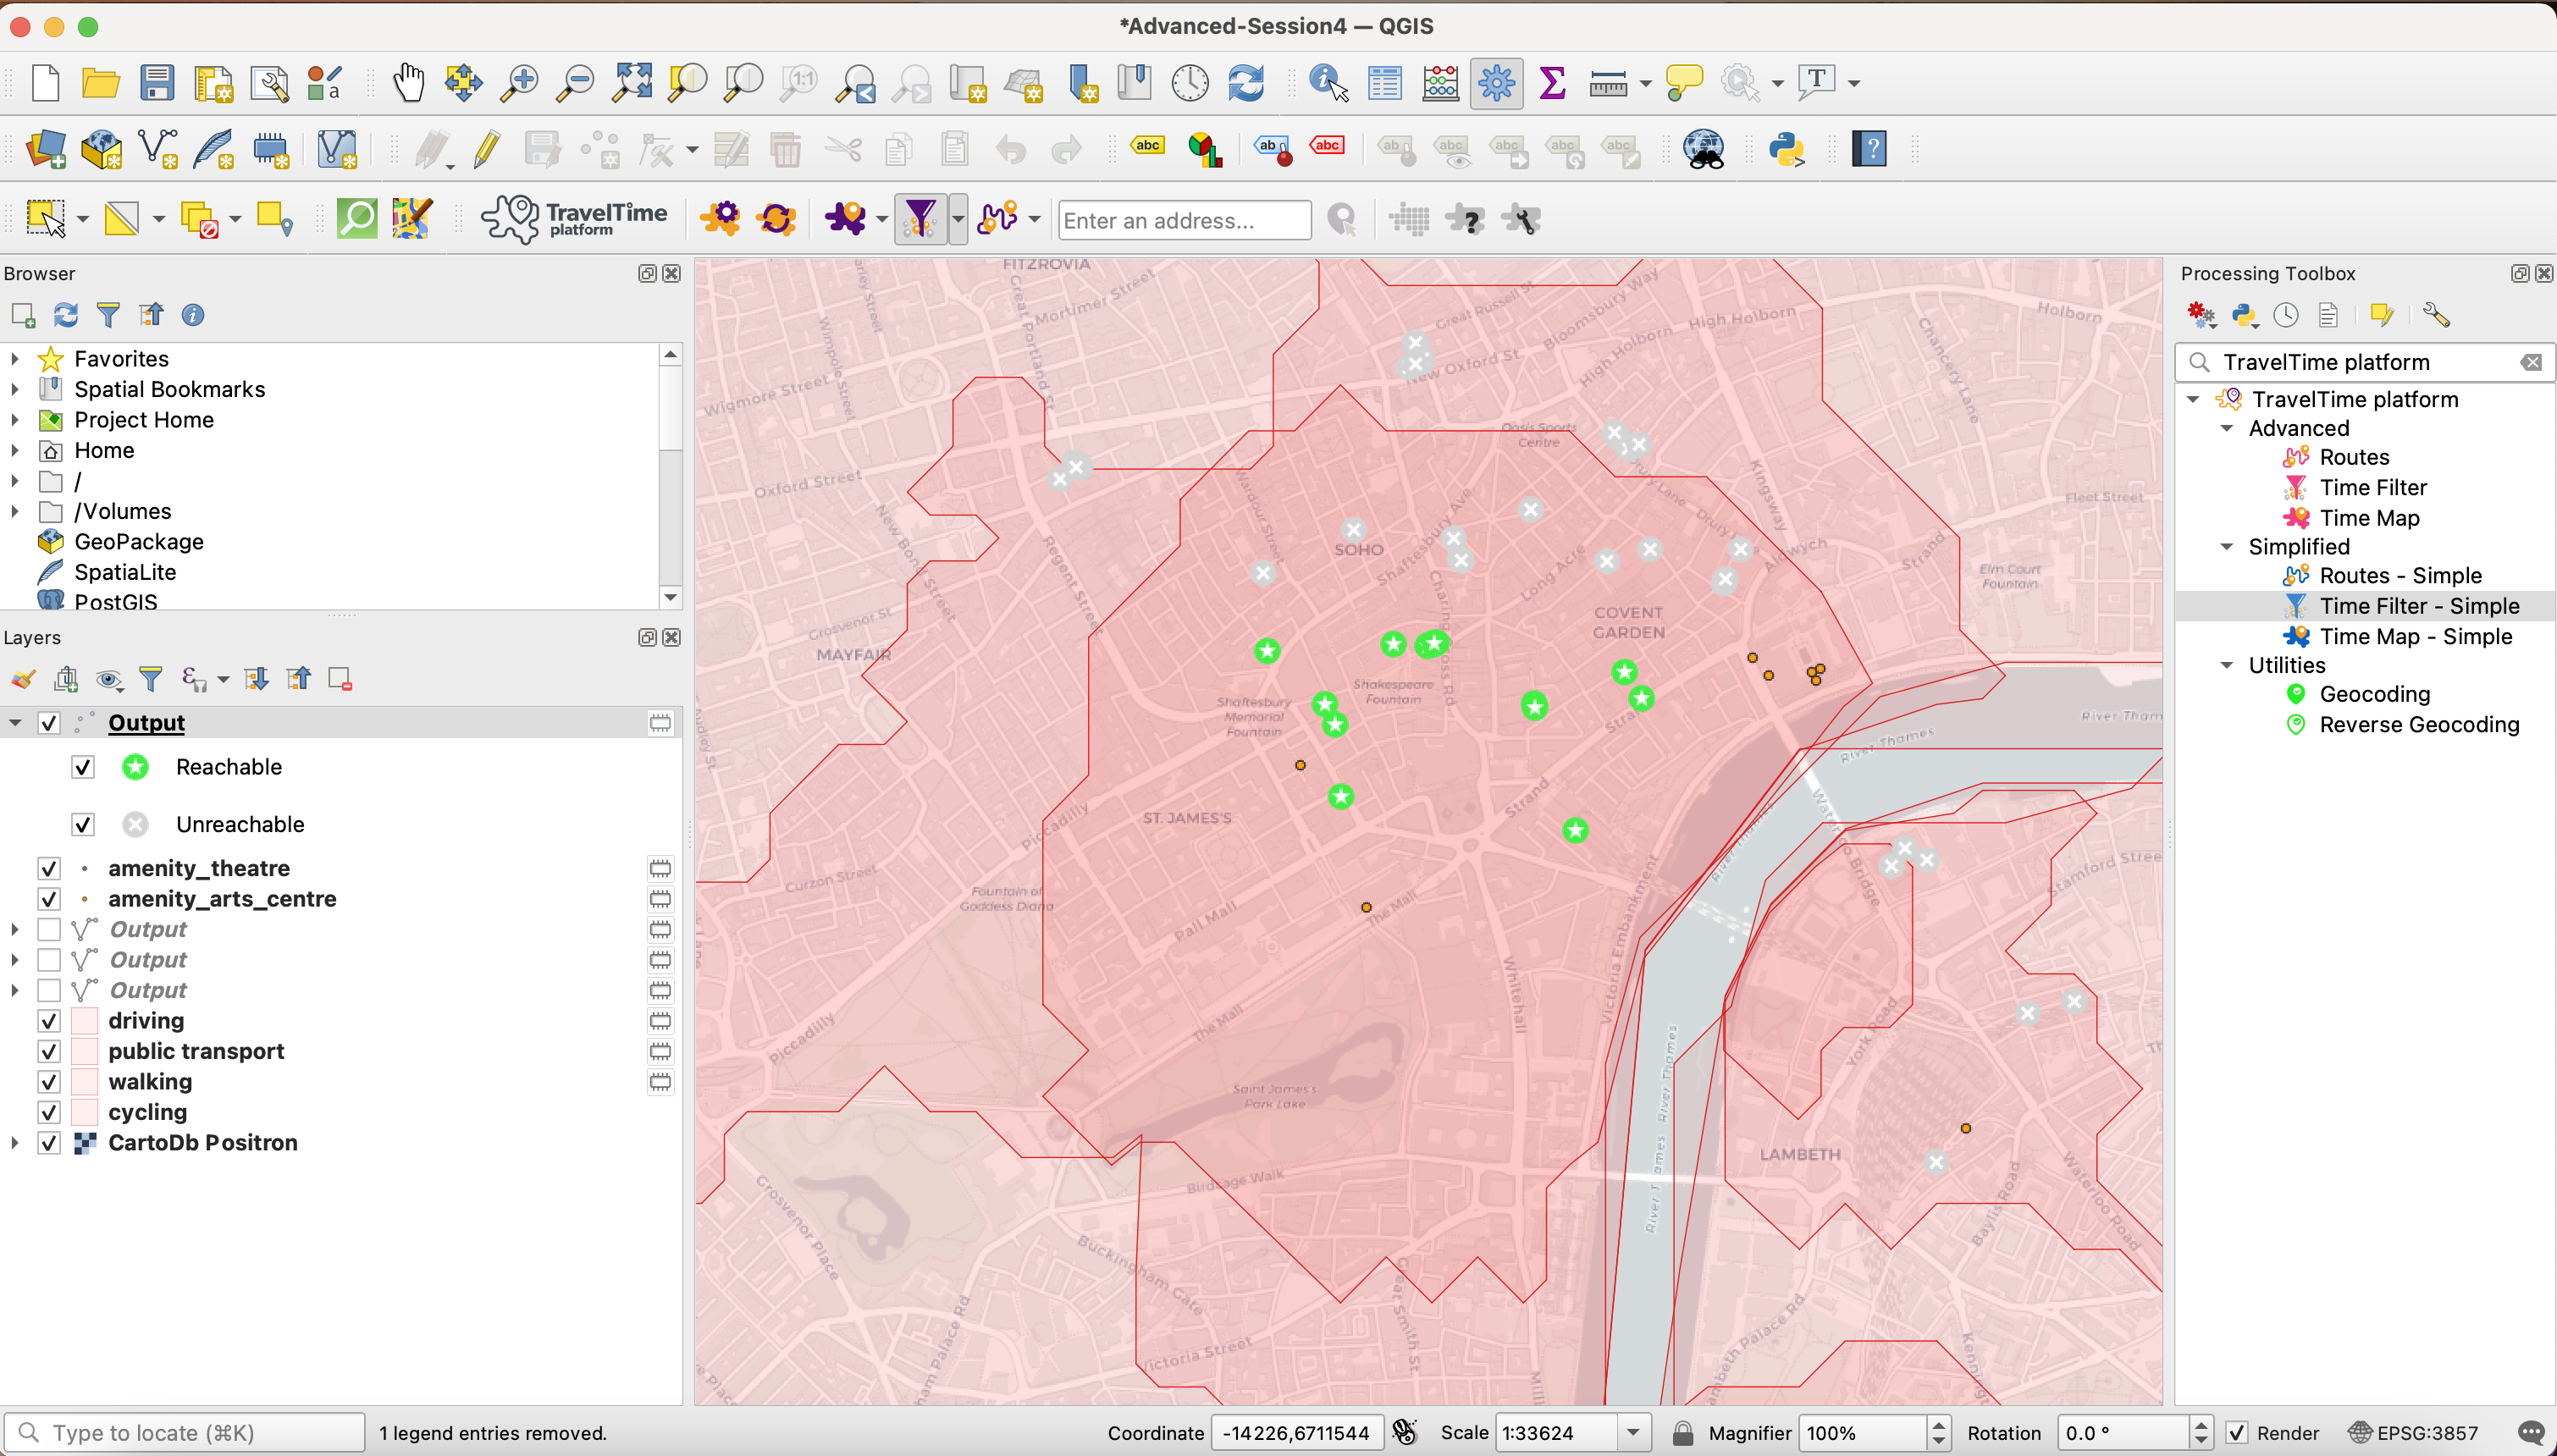
Then click on the icon to get your cursor as a black cross, and click on Trafalgar Square. A new layer is generated, where the theatres within 10 minutes walk of the point you clicked are highlighted in green, and in grey are the remaining theatres.
You could repeat the operation with the arts centres. But what we want to find out next is which ones of the green theatres have an arts centre within 10 minutes walk. This could help us, for instance, plan out a cultural tour in the area.
5.3 Extract pre-selected theatres
To do so we first need to extract the green theatres as a new layer. By looking at the symbology definition of the Reachable/Unreachable theatres layer, we can see that the distinction is made using a field reachable, of value 1 if the theatre is within 10 minutes walk of Trafalgar Square and 0 if it is not. In your processing toolbox, look for Extract by attribute. You want to extract features where reachable = 1. Specify where you want to save your layer in your Advanced-Session4 geopackage, maybe call the layer Reachable_Theatres, and run the tool.
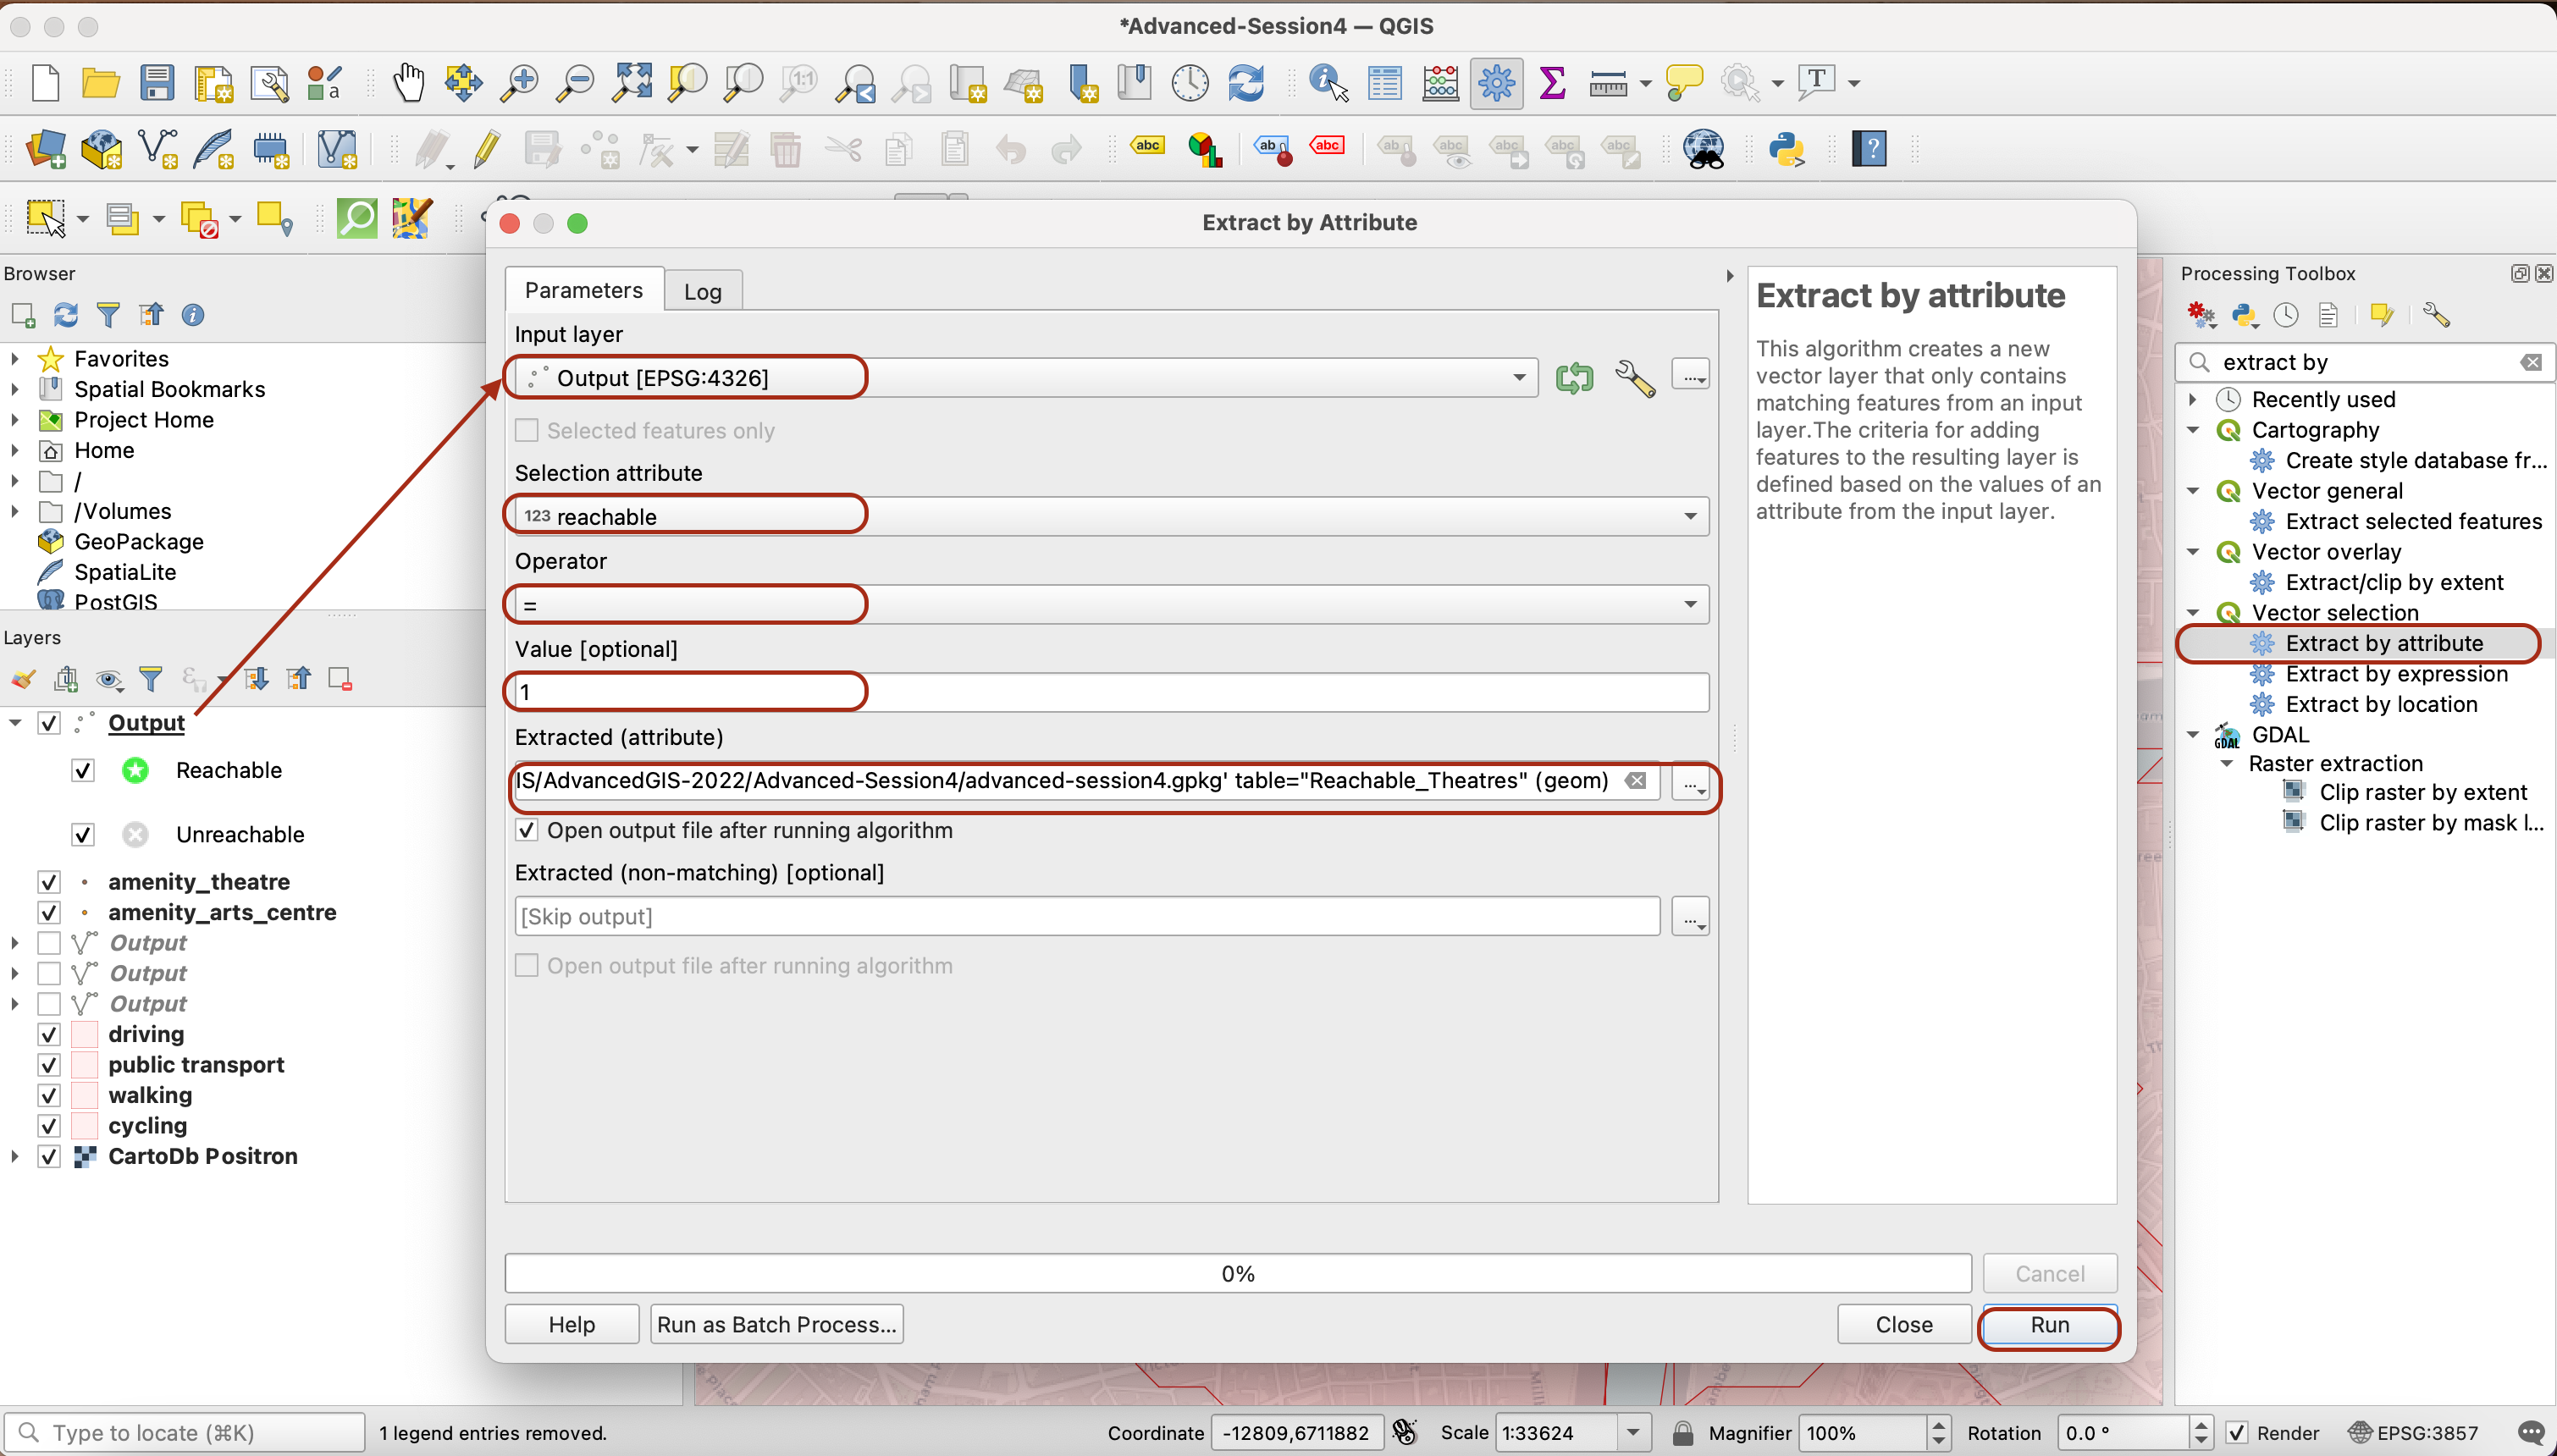
You now have a new layer for the pre-selected theatres.
5.4 Filter the arts centres within 10 minutes cycle of pre-selected theatres
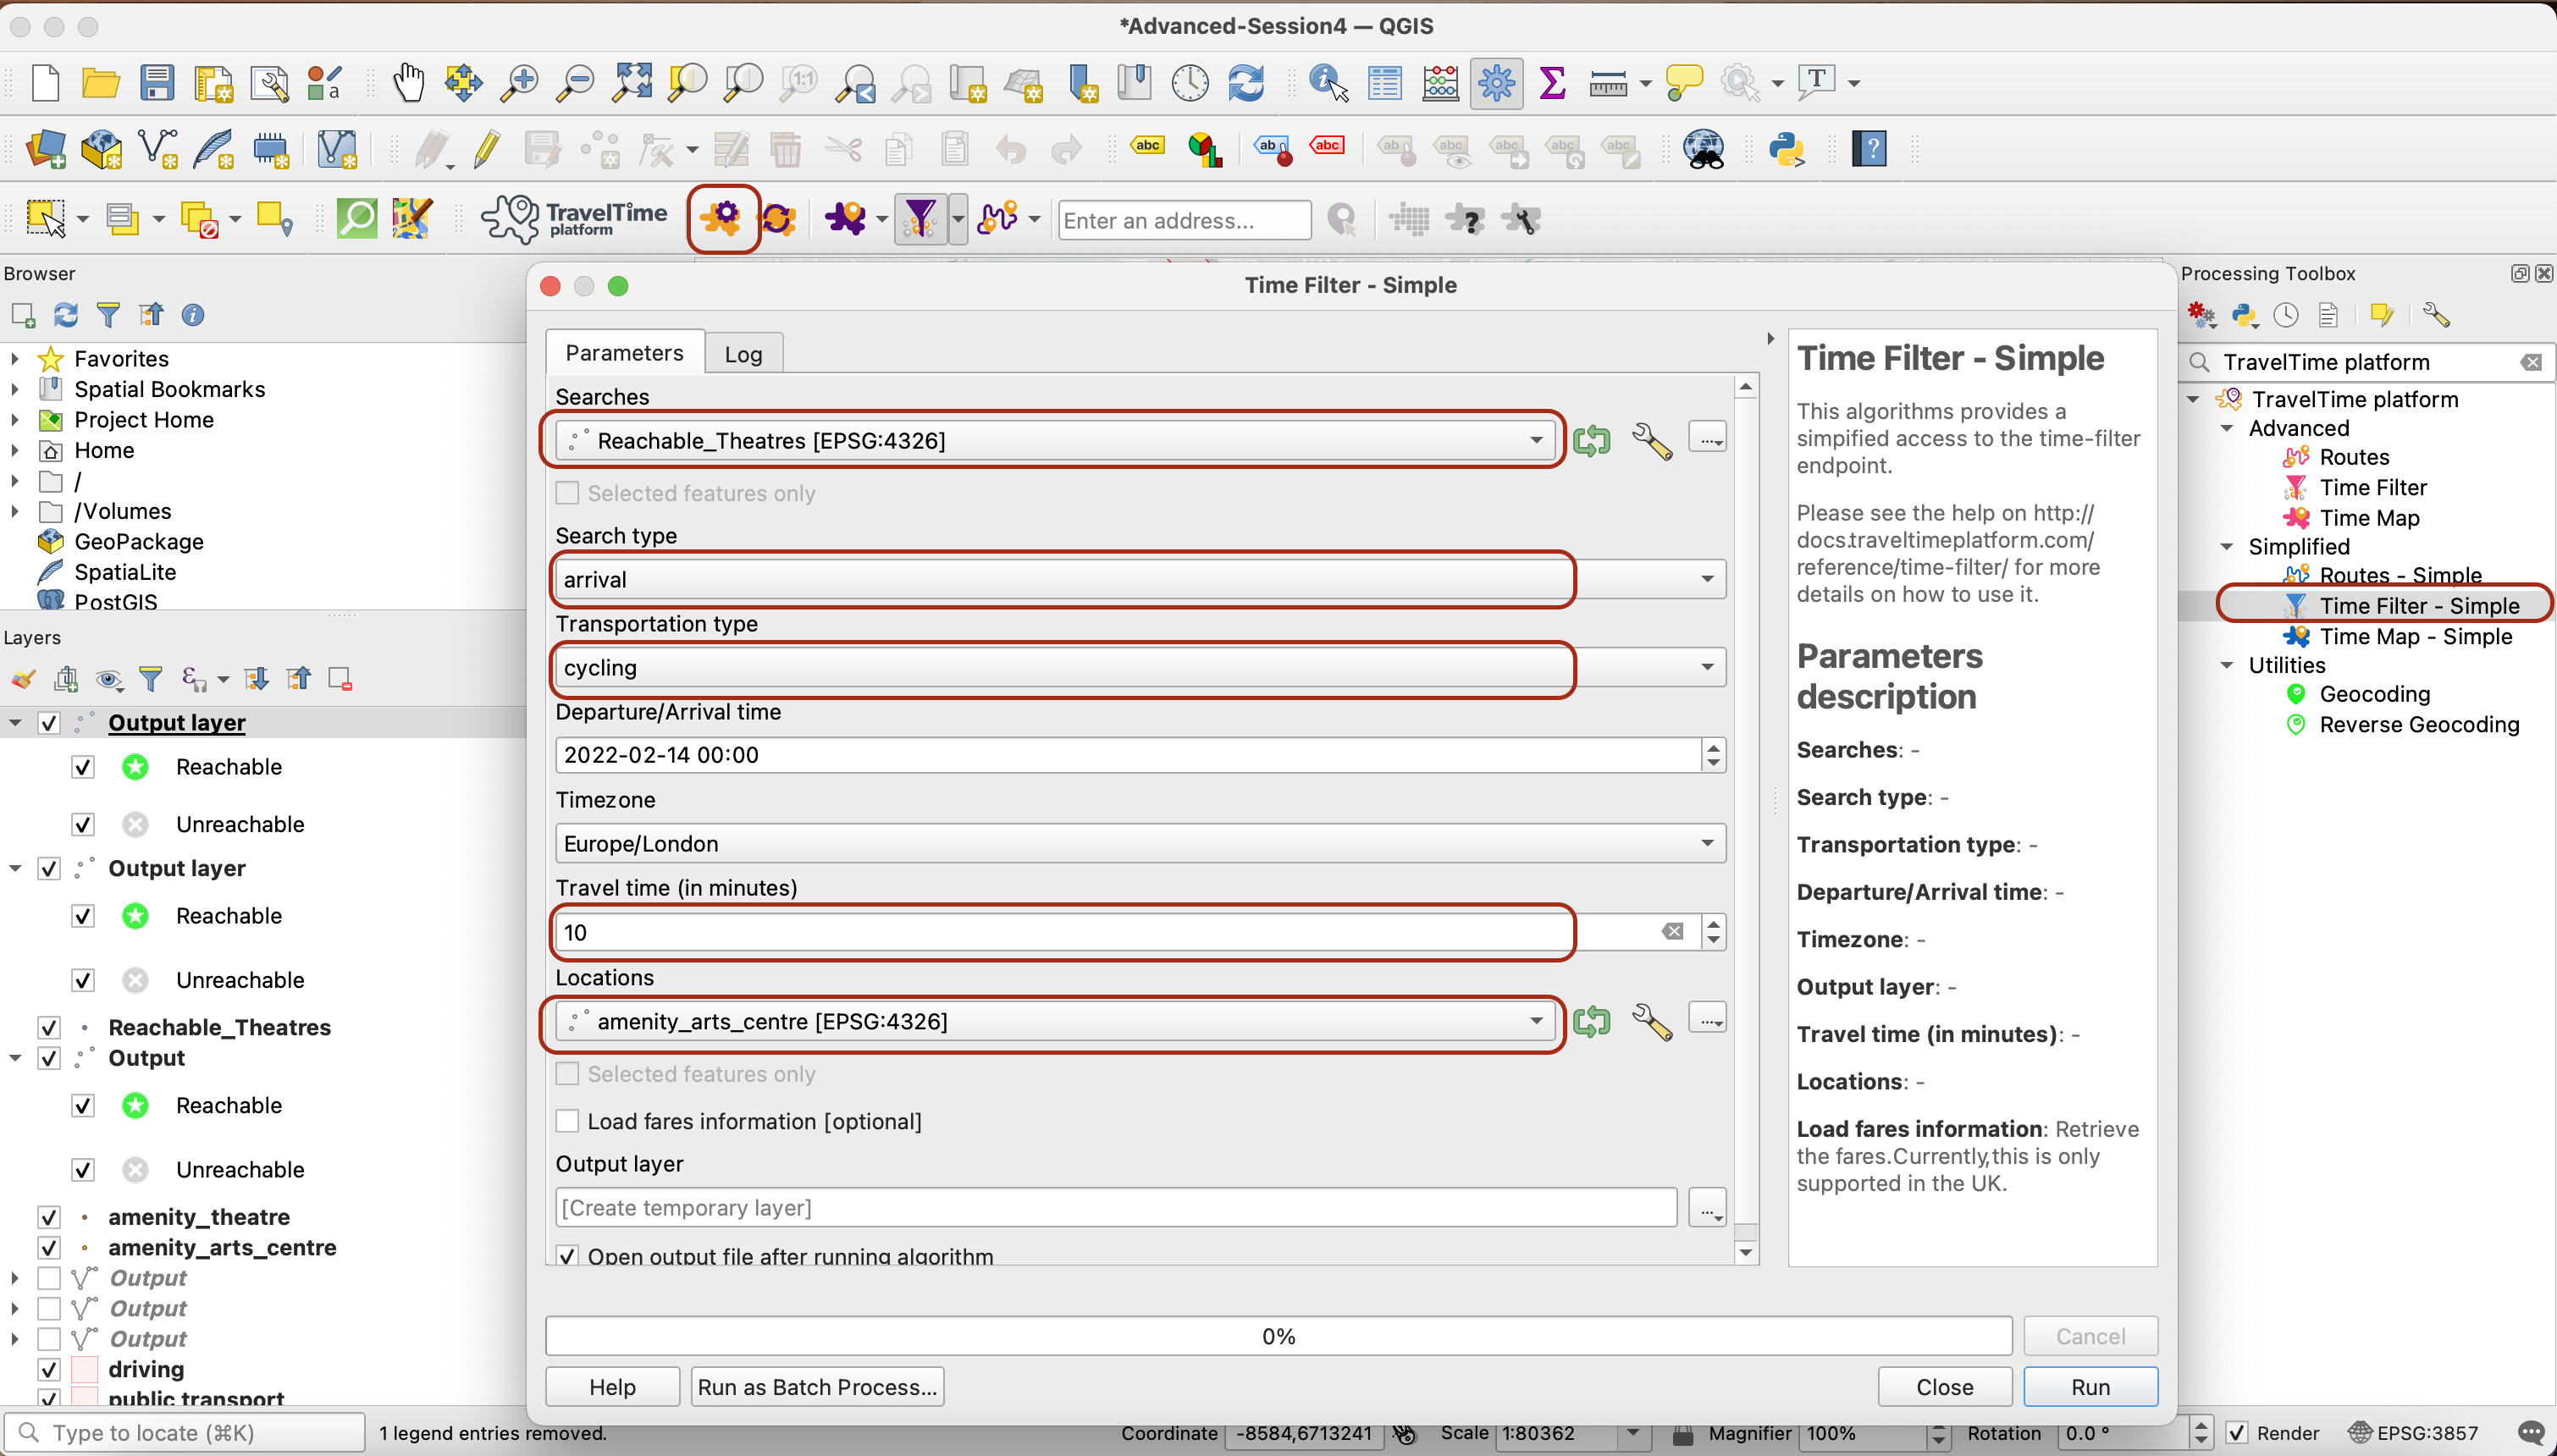
The final step is to filter out, in our arts centres layer, the arts centres that are within 10 minutes cycle of our pre-selected theatres.
To do so, we are going to use the TimeFilter - simple tool in TravelTime. Click on the toolbox icon to bring up the tools again and click on the TimeFilter - Simple. Specify the parameters as below to make sure you filter the arts centres within 10 minutes cycle of the pre-selected theatres:
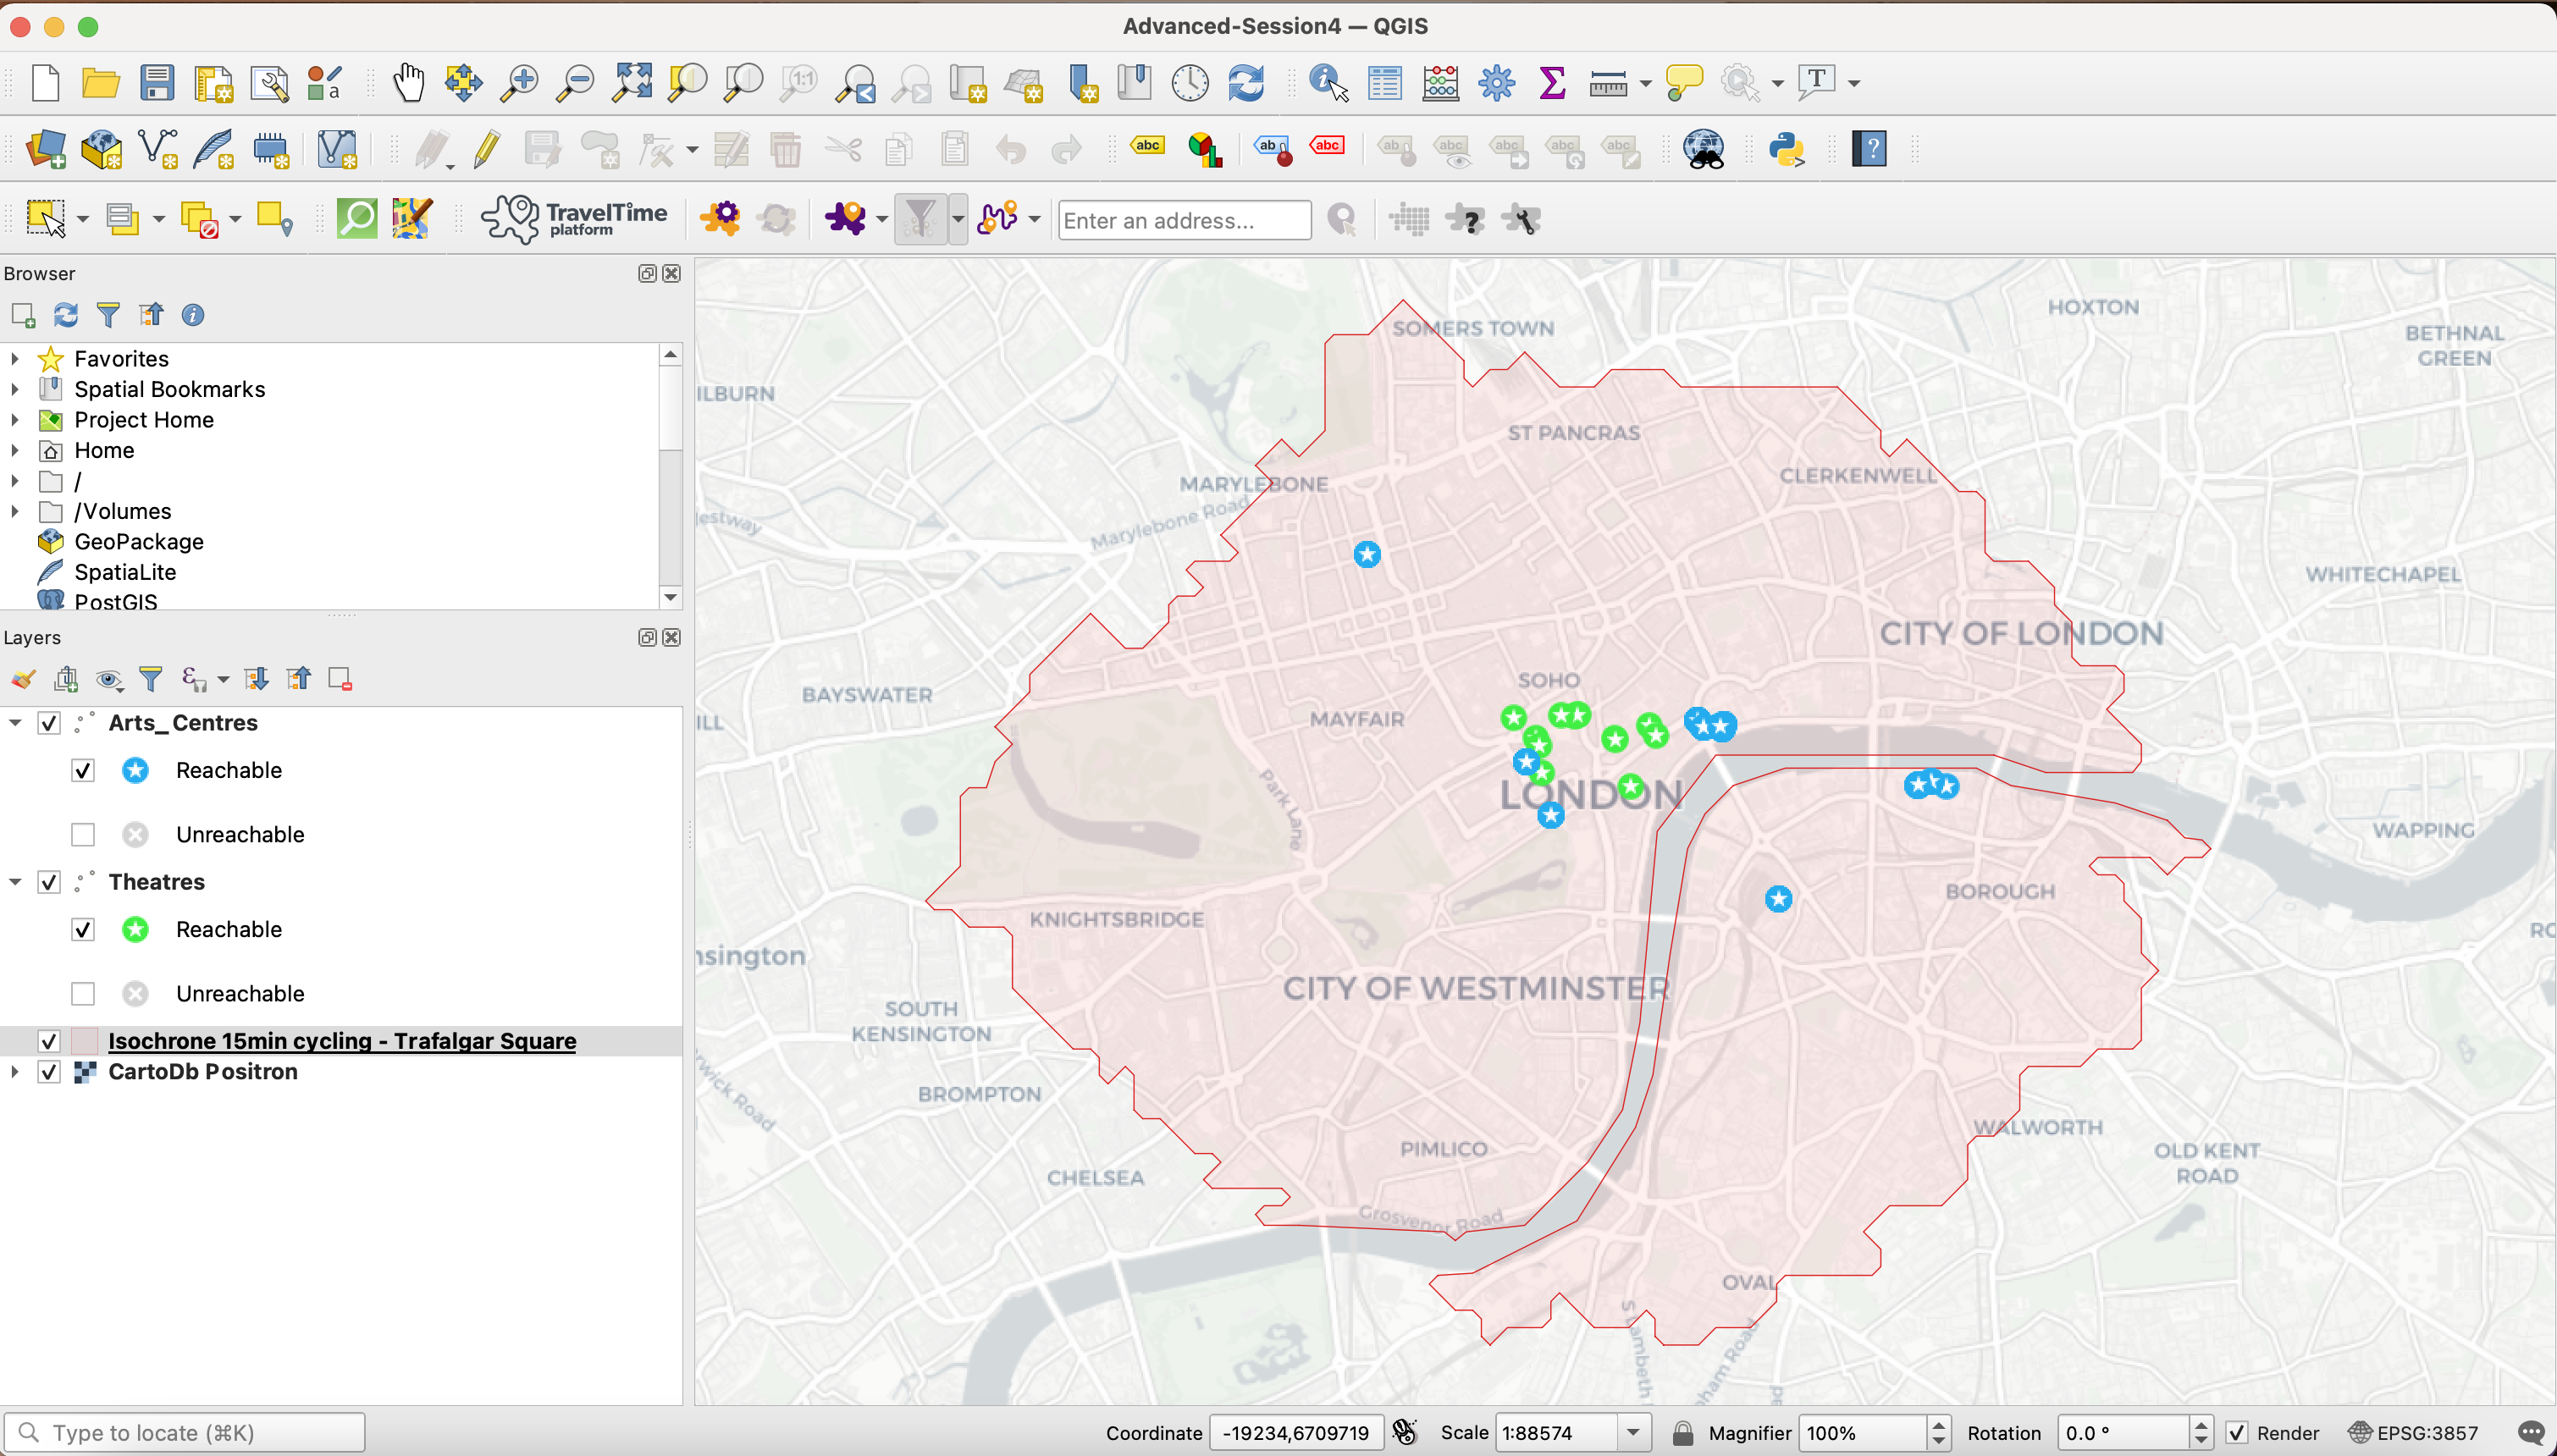
You have successfully selected the arts centre within 10 minutes cycling fo our pre-selected theatres. You can now tidy up your project, save the output layers that are important to you in your geopackage, and make some edits to your symbology to make your map readable.
Practice exporting the map using the print layout, and you are done with this tutorial!
Note:
Because TravelTime calls an API, you may get an error from time to time when using the TimeFilter - Simple tool, telling you you have exceeded the number of calls to the API. You will then need to wait an hour to be able to run the tool again; you may also need to reduce the size of the two point datasets you are trying to match by traveling distance.